Organisation setting to enable tracking
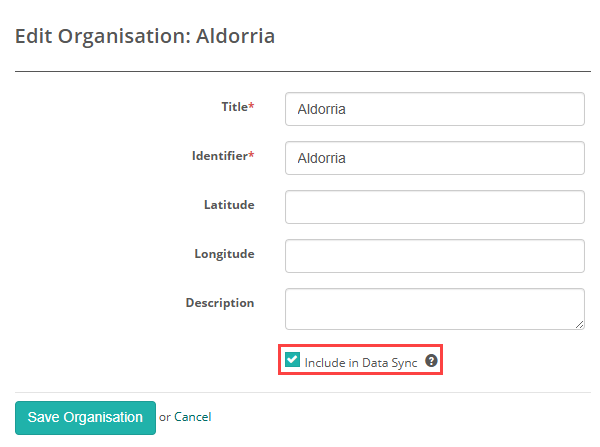
This setting controls whether student-linked attempts within this organisation are included in the Data Platform sync. Tracking will only occur if this setting is enabled at the organisation level, and the sync will run only when the Assessment Program is in the Reporting state.
Open the relevant organisation in edit mode, select the Include in Data Sync option, and then save your changes.
Add Assessment program
To create a new Assessment Program, follow these steps:
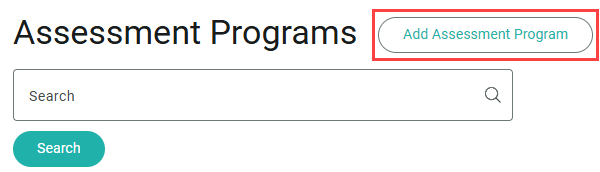
Go to Deliver > Assessment Programs.
Select Add Assessment Program.
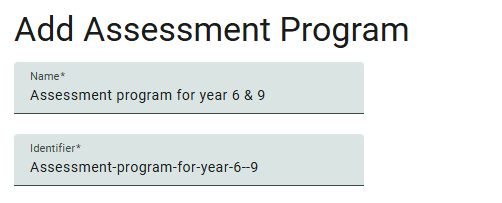
The Add Assessment Program screen will appear.
Enter a Name for your program. The Identifier field will auto-populate based on the name.
1. Select Assessment Data
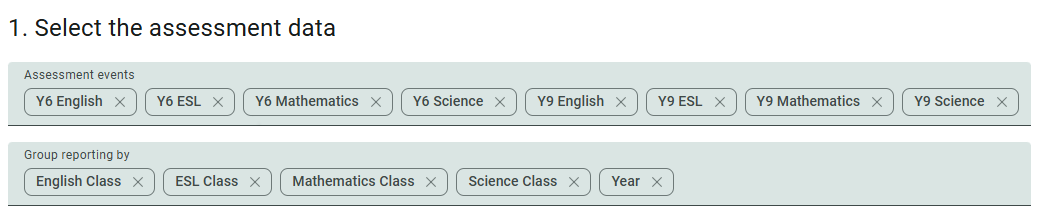
Under 1. Select Assessment Data:
- In the top row, select the relevant Assessment Events.
- In the bottom row, choose how you want to Group reporting by. These are your group types, such as English Class, Mathematics Class, or Year Level.
- You can read more about group types here.
Next, you’ll need to add Reporting dimensions.
2. Reporting dimensions
Reporting Dimensions define how student results are categorised and interpreted within a report. They let you break down performance beyond just total scores, giving you insights into things like:
- Subject domains (e.g. English, Mathematics, Science)
- Subject subdomains (e.g. for the English subject domain, Reading, Writing, Grammar)
- Custom attributes added during authoring (e.g. Authoring Domain or Skill Category)
There are two Dimensions available, Module and Custom attribute. Let’s look at the module option first.
Module dimension type
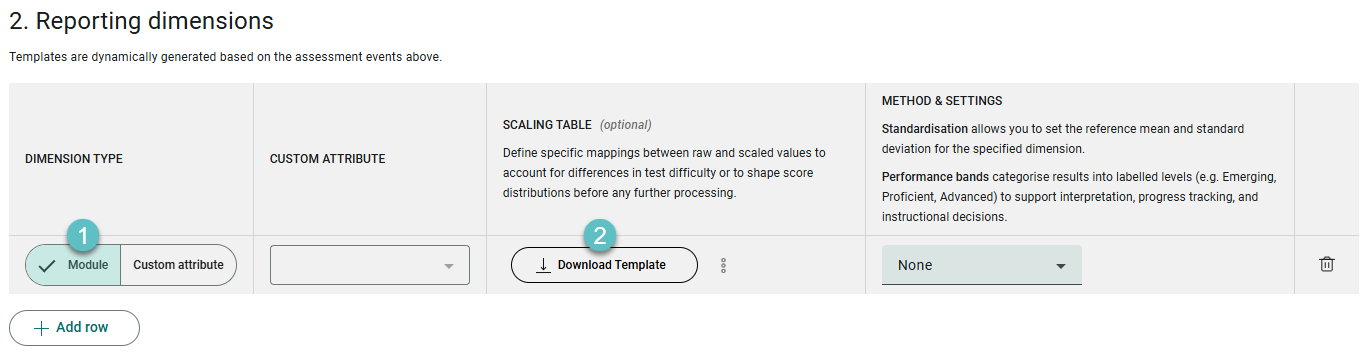
Use the Scaling Table to define specific mappings between raw and scaled values to account for differences in test difficulty or to shape score distributions before any further processing.
- Select Module.
- Download the template which will be dynamically populated based on the assessment data you selected in the previous step. This step is optional.
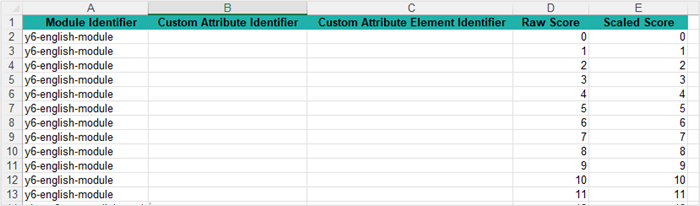
Complete the spreadsheet as required. Below is an example of the template.
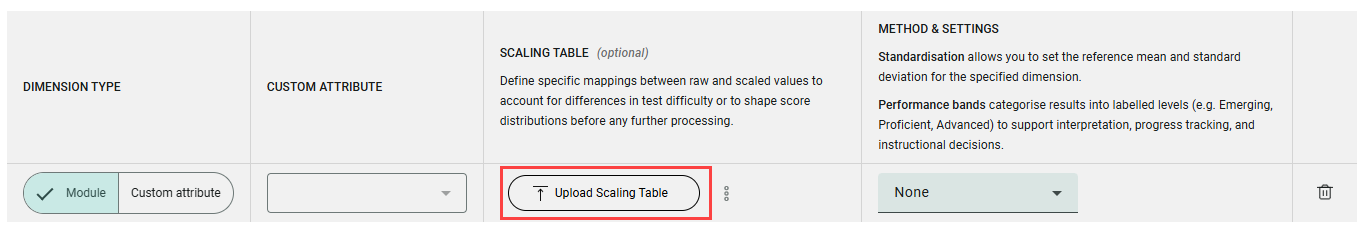
The button changes to Upload Scaling Table.
Upload your completed spreadsheet.
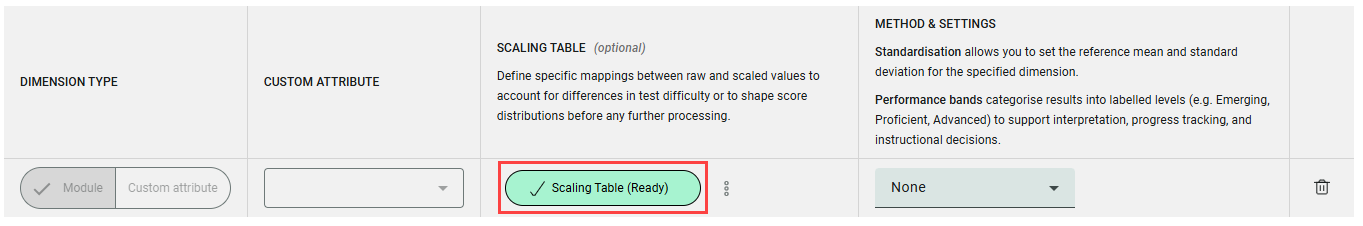
The button updates to Scaling Table (Ready).
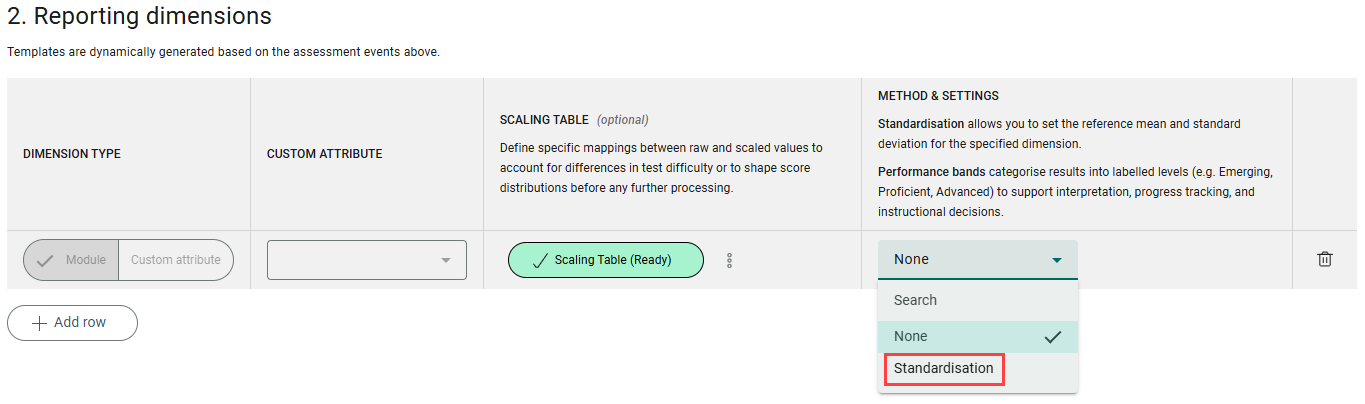
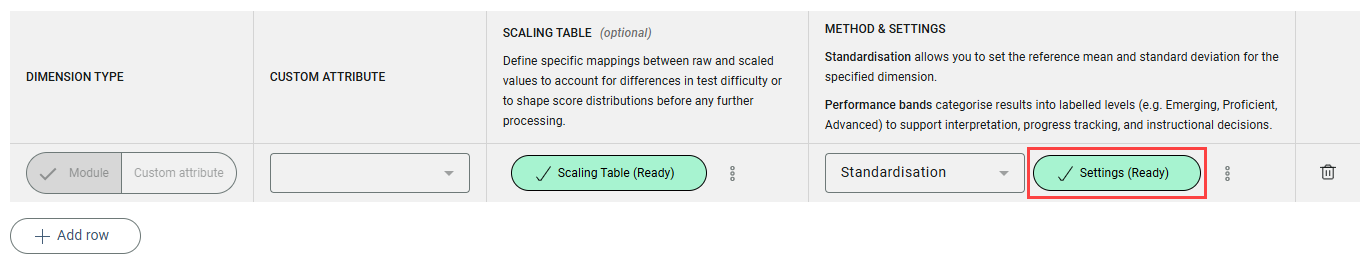
Method & settings
Standardisation allows you to set the reference mean and standard deviation for the specified dimension. Performance bands categorise results into labelled levels (e.g. Emerging, Proficient, Advanced) to support interpretation, progress tracking, and instructional decisions.
Select Standardisation from the Method & settings dropdown.
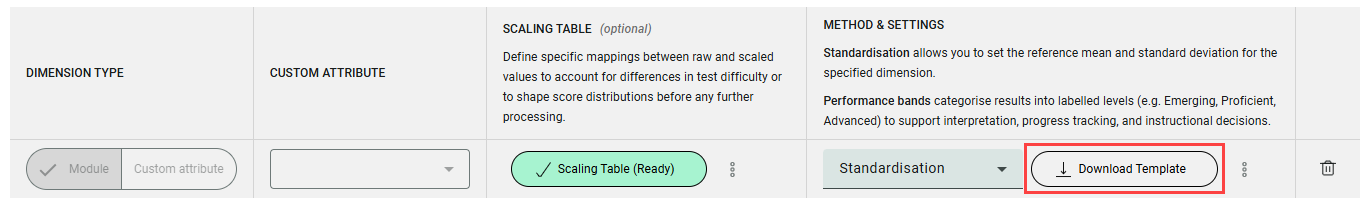
A button to download the template displays. Download the template which will be dynamically populated based on the assessment data you selected in the previous step.
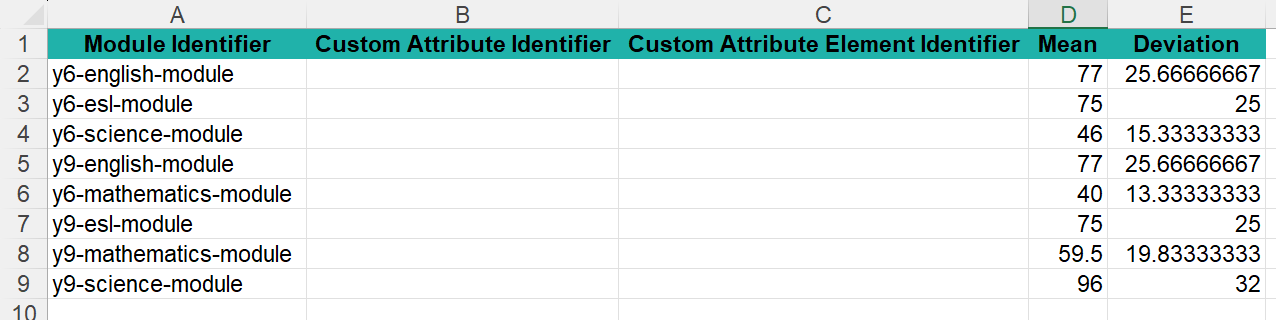
This is an example of the template.
The button changes to Upload Settings.
Complete your spreadsheet and upload it.

The button updates to Settings (Ready).
To add further dimensions, select the + Add row button.
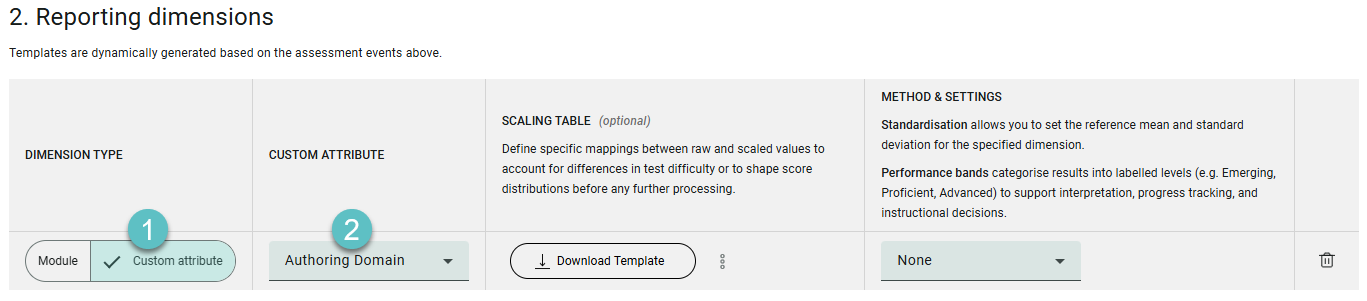
Custom attribute dimension type
Next let’s look at selecting the Dimension type of Custom Attribute.
- Select Custom attribute as the DIMENSION TYPE.
- Select a CUSTOM ATTRIBUTE. In this example we’ve selected Authoring Domain.
For the SCALING TABLE (Scaling tables are optional), follow the same steps as covered above in the Module dimension type.
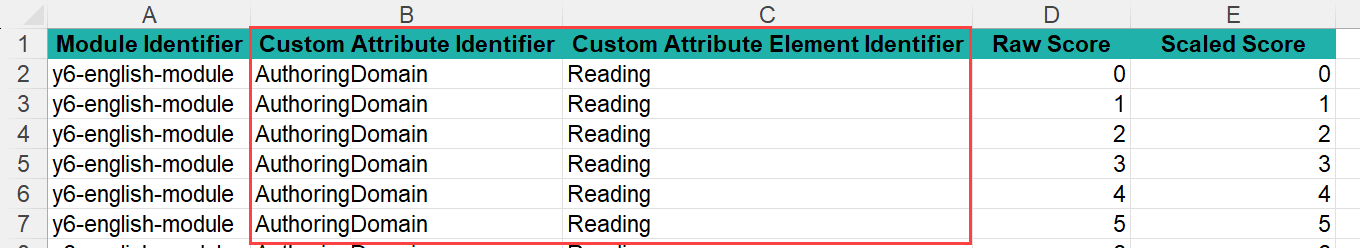
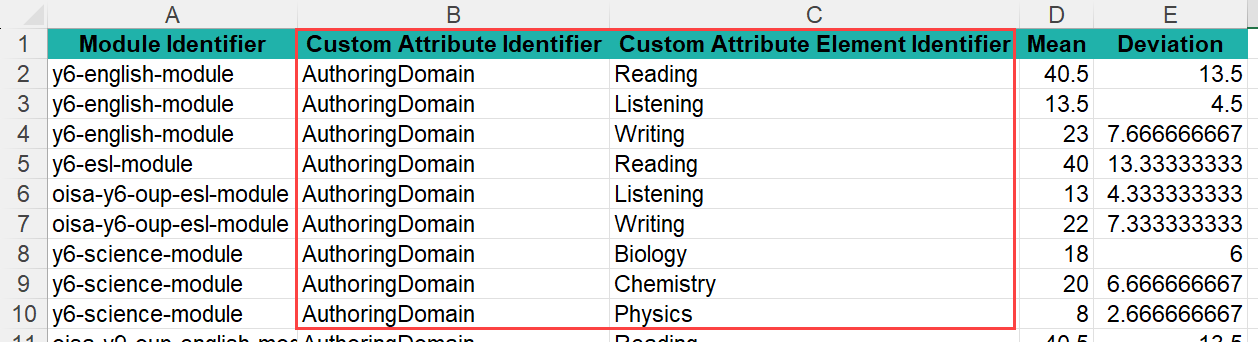
The system will populate the template with Custom Attribute columns relating to the custom attribute you selected. Below is an example of the template.
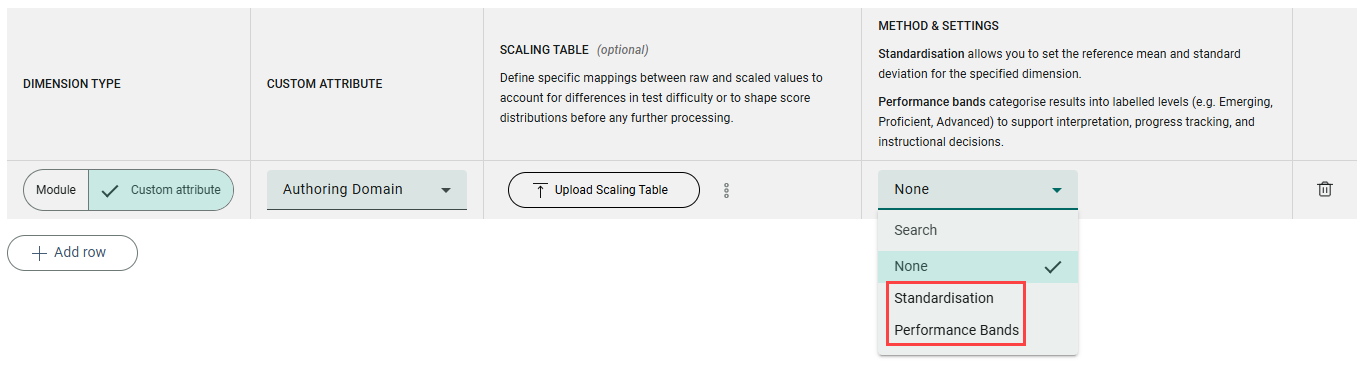
For METHOD & SETTINGS, you have two options to select from, Standardisation and Performance bands.
For Standardisation, the steps are the same as covered above in Module dimension type.
The system will populate the template with Custom Attribute columns relating to the custom attribute you selected. Below is an example of the template.
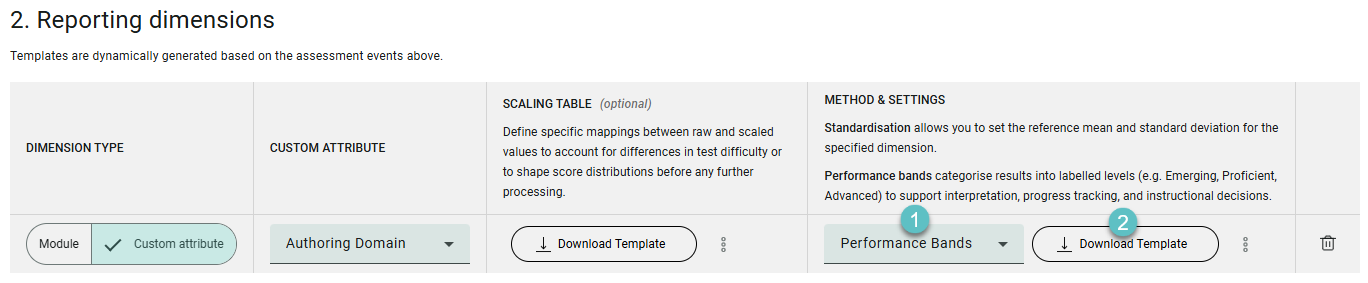
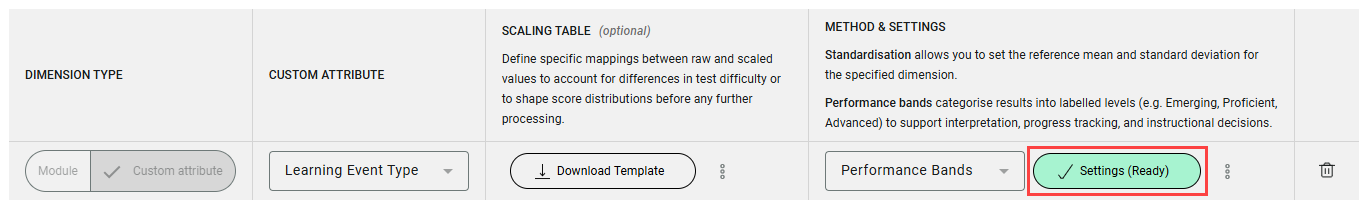
Performance Bands
Performance bands categorise results into labelled levels (e.g. Emerging, Proficient, Advanced) to support interpretation, progress tracking, and instructional decisions.
To add performance bands:
- Select Performance Bands.
- Select Download Template.
The template populates based on the custom attribute you selected and default Labels which you can customise to suite your requirements.
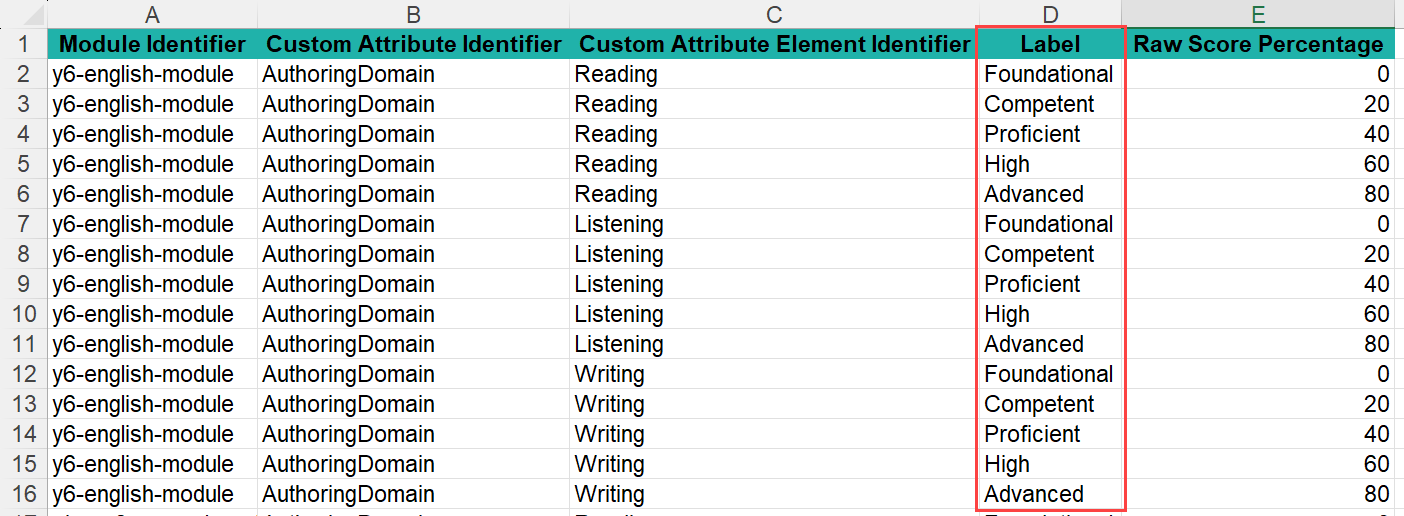
The Download Template button changes to Upload Settings.
Complete your spreadsheet as required and upload it.
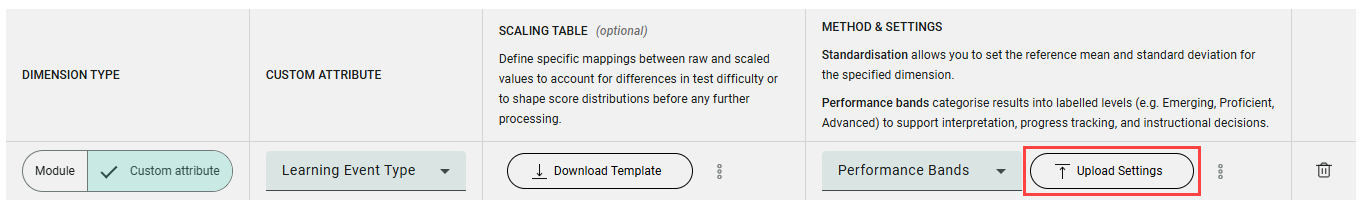
The system validates the spreadsheet and the button changes to Settings (Ready).
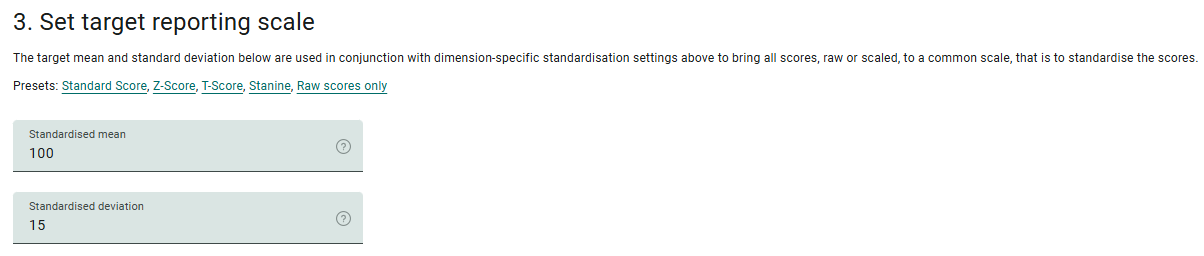
3. Set target reporting scale
The target mean and standard deviation below are used in conjunction with the dimension-specific standardisation settings above to bring all scores—whether raw or scaled—onto a common scale. This process is known as standardisation.
You can choose from the following presets:
- Standard Score – Mean = 100, SD = 15
Typical range: 55 to 145 (theoretically unlimited) - Z-Score – Mean = 0, SD = 1
Typical range: -3 to 3 (can be any real number) - T-Score – Mean = 50, SD = 10
Typical range: 20 to 80 (theoretically unlimited) - Stanine – Mean ≈ 5, SD ≈ 2
Range: 1 to 9 - Raw Scores Only – No standardisation applied
Set the required reporting scale by selecting one of the preset options. In the example below, Standard Score is selected.
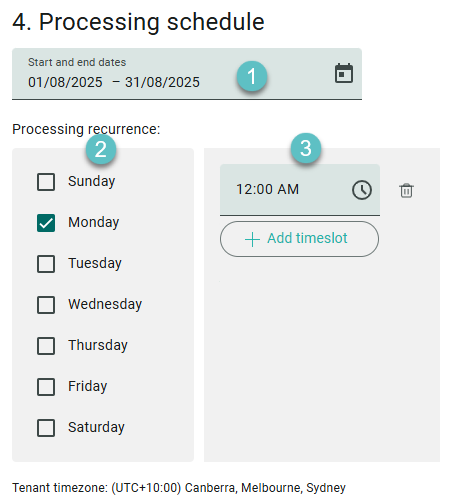
4. Processing schedule
In this step, you will define when the reports should be processed.
- Select the Processing Period
At the top of the section, specify the start and end dates for the processing schedule. In the example, the schedule runs from 01/08/2025 to 31/08/2025. - Choose Processing Days
Under Processing recurrence, select the days of the week on which the system should process reports.- In the example shown, Monday is selected. You can choose one or multiple days depending on your reporting needs.
- Set the Time
On the right side, set the time of day when processing should occur.- In the example, the processing time is set to 12:00 AM.
- To add more times, click + Add timeslot.
- To remove a timeslot, click the bin icon beside the time.
Timezone
The processing schedule uses your tenant’s timezone, displayed at the bottom of the section (e.g. UTC+10:00 Canberra, Melbourne, Sydney).
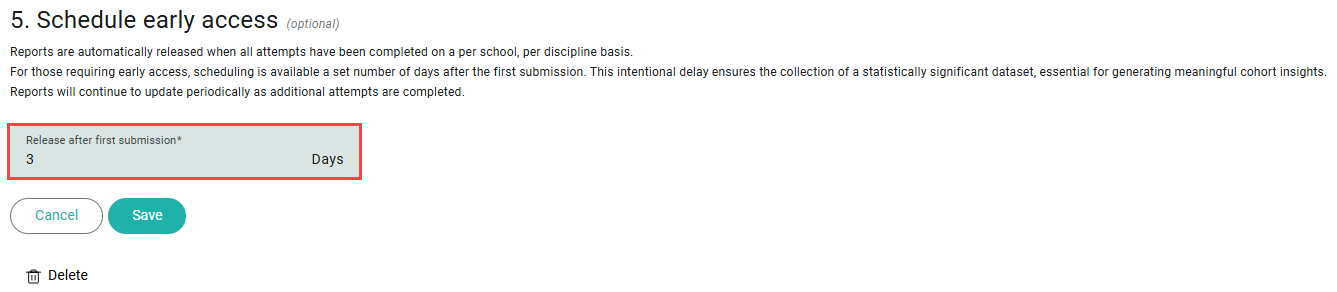
5. Schedule early access (optional)
By default, reports are automatically released once all attempts have been completed—this is done per school and per discipline.
If early insights are required, you can schedule early access to reports. This allows reports to be released a set number of days after the first submission, rather than waiting for all students to complete the assessment.
Specify the number of days to wait after the first submission before the report is released.
In the example shown, reports will be released 3 days after the first student completes the assessment.
This wait period allows time for sufficient data to accumulate, helping ensure that early reports reflect a statistically significant portion of the cohort for meaningful analysis.
Reports will continue to update automatically as additional submissions are received, ensuring that insights remain current.
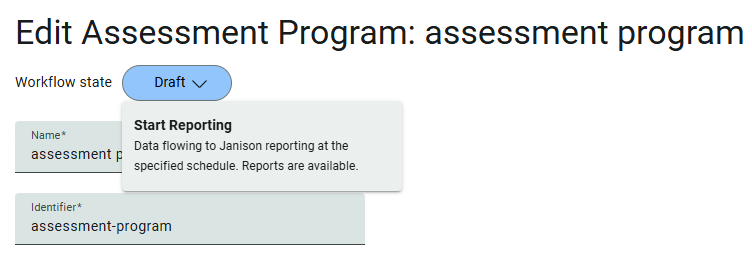
Start reporting
When you’re ready to begin reporting, set the workflow state from Draft to Start Reporting. This option is available at the top of the page.
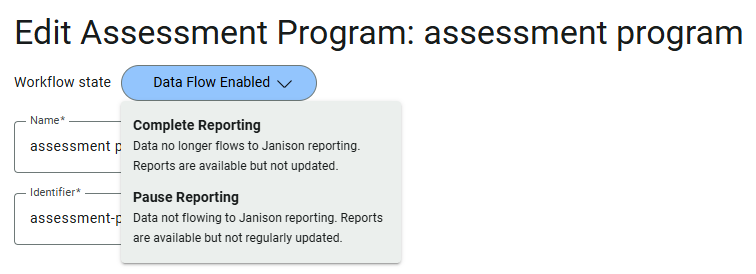
Once the workflow state is set to Data flow enabled, you have the following options:
- Complete Reporting — Data will no longer flow to Janison Reporting. Reports remain available but will not be updated.
- Pause Reporting — Data will temporarily stop flowing to Janison Reporting. Reports remain available but may not reflect new data until reporting resumes.
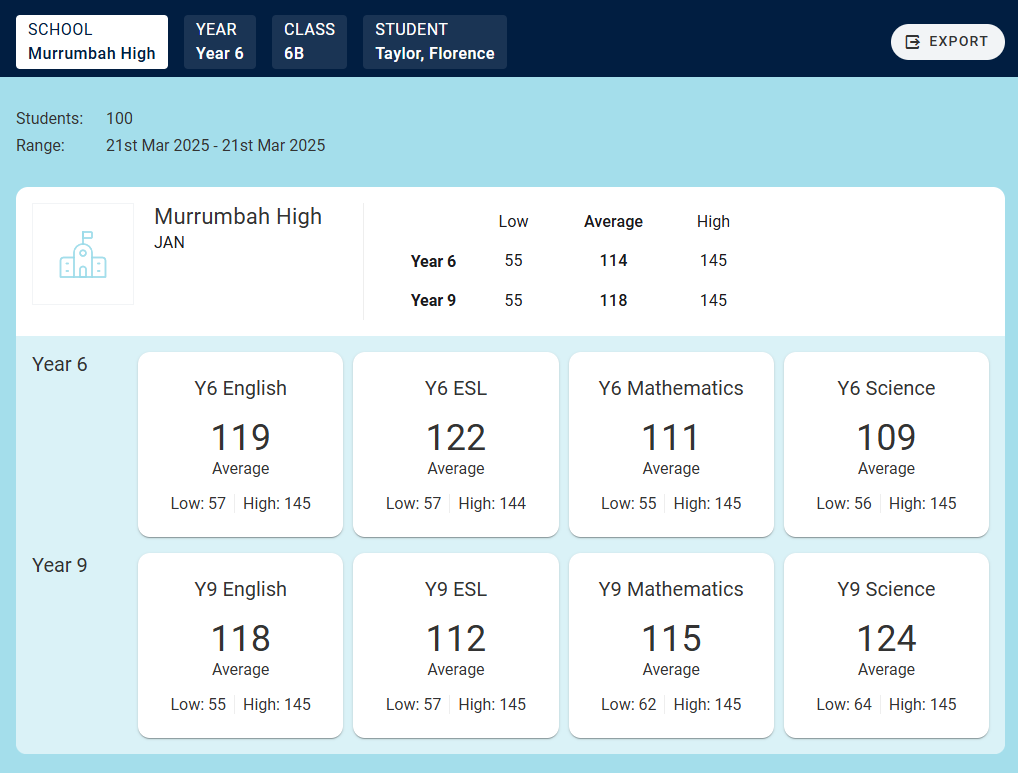
When the data flow is active and ready, you can access the reports through your reporting site.