Guttman report
The Guttman Report can be used for reporting on tests by summarising the hierarchical arrangement of test items based on their difficulty or proficiency levels. The report can provide valuable insights into the progression of difficulty and mastery among test takers. It allows for identifying patterns of responses and determining the level of proficiency achieved by individuals or groups.
By presenting a clear hierarchy of test items, the Guttman report helps educators and evaluators assess the reliability and validity of the test and identify areas of strength and weakness in the test-takers’ knowledge or skills. This information aids in making informed decisions about test design, item improvement, and educational interventions.
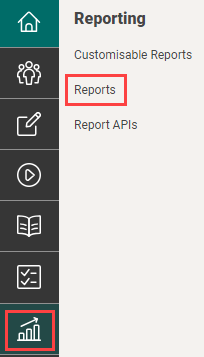
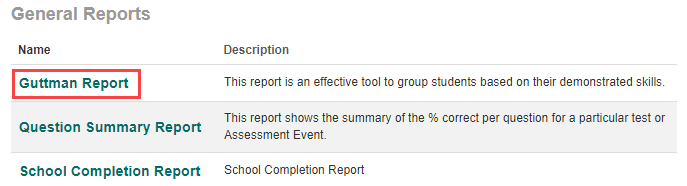
Run the report
To access the report, browse to Reporting > Reports.
Scroll to General Reports and select Guttman Report.
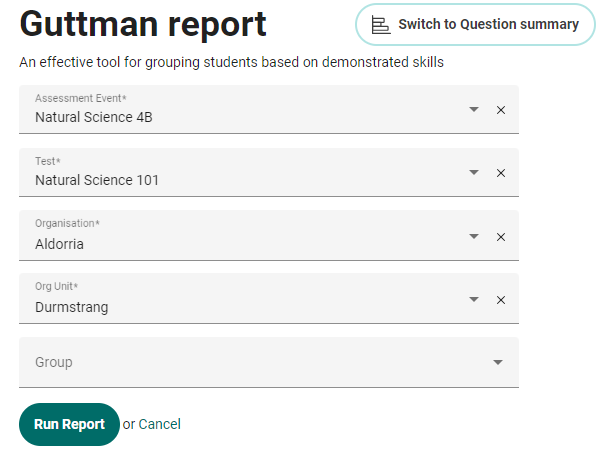
Make your selections from the filter page and then select Run Report.
The report is generated.
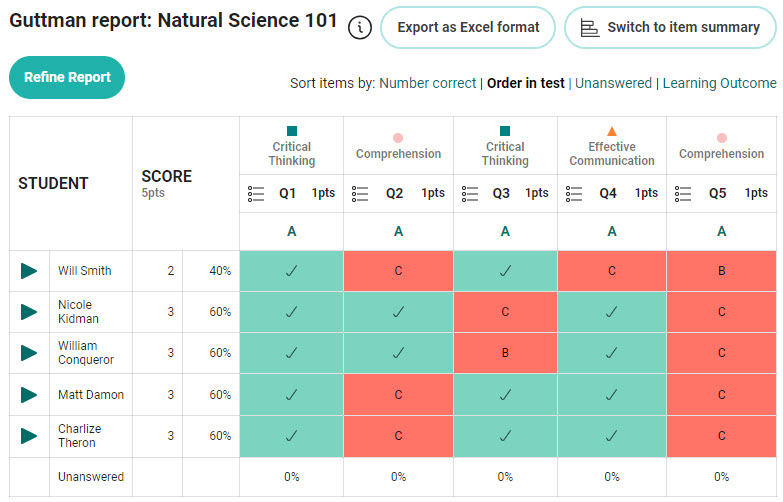
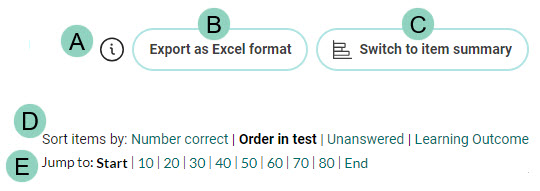
Below is a summary of the purpose of the buttons and links at the top of the report. Please refer to the screen capture below:
- Select to scroll to the text information about the report.
- Export the report to excel. You can download sample excel spreadsheet here to see what it looks like.
- Switch to the Item summary report using the same filter information used for the current Guttman report. We have covered the Item summary report in our next topic.
- Using the links at the top of the report grid, you can sort the items by the order they were displayed in the test (Order in test), the number of test-takers that responded correctly (Number correct), by percentage of tests-takers who didn’t respond to the item, Unanswered or by Learning outcome. We’ve covered learning outcome in detail below.
- Jump to: will only show if you have more than 10 items. You can switch to view items in lots of 10.
Each row represents a test-taker, and each column represents a test item. Each cell in the matrix indicates whether the test-taker got the item correct or incorrect. Test items are grouped into a hierarchy based on their difficulty level, with the easiest items at the left of the scale and the most difficult items at the right. test-takers are ordered based on their test performance, with test-takers with the lowest scores at the top and the highest scores at the bottom.
The ![]() icon you see in the top row reflects the item type. Hover over the icon to view this information. In this example the item type is multiple choice.
icon you see in the top row reflects the item type. Hover over the icon to view this information. In this example the item type is multiple choice.
View responses

- Select the green cell
 to view the test-taker’s response where they have responded to the item correctly.
 - Select the orange cell
 to view the test-taker’s response where they have responded to the item incorrectly.
 - Select the
 arrow to view the test-taker’s attempt in the test player where you can view their responses to all the items.
All these views demonstrate how the test-taker sees the item.
When viewing the item and attempt, an orange bar displays at the top of the screen with test-taker and test details.
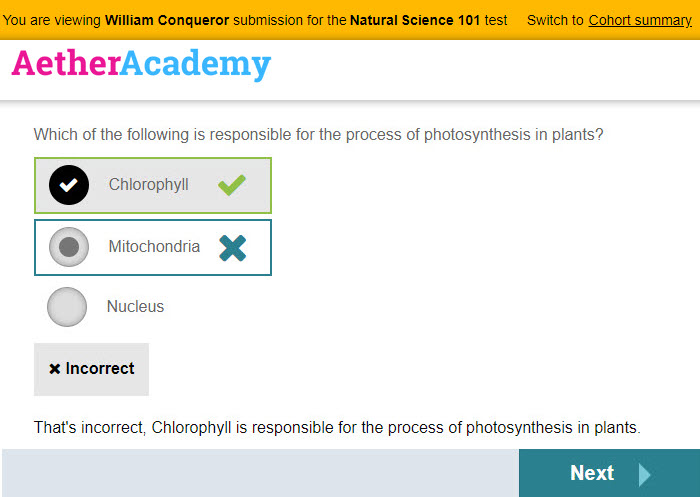
A link exists to switch to Cohort summary which details the cohort results.
This view gives markers and teachers an overview of how the cohort has performed for the item:
- The percentage of test-takers who got the item correct and the percentage of test-takers who got it incorrect.
- The feedback test-takers see if they get the item correct or incorrect.

Learning outcome
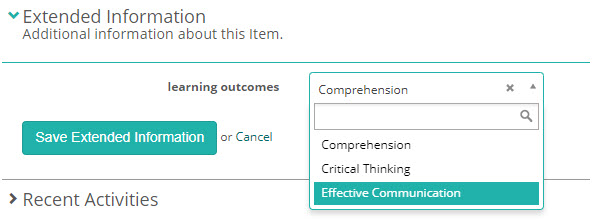
Custom attributes linked to items display at the top of the Guttman report. This means that you can specify the values that display here. See our document on custom attributes to learn how to create them.
In the example below, we have created a custom attribute type of a ‘list’ and added three elements: Comprehension, Critical Thinking, and Effective Communication.

Before the learning outcomes display on the report, you will need to set them and link them to your items.
Navigate to Settings > Test Designer Settings > Test Authoring Settings and select your Custom Attribute for Learning Outcome.

Once you have set the learning outcome, they will display on your item in the Extended Information expandable of the item. Select the relevant option and save.
Once you have completed these steps, this row will display on your report.
Guttman report insights
Item difficulty: The Guttman scale can help to identify which items are the most difficult for test-takers to answer correctly, and which are the easiest. This information can be used to adjust the difficulty level of future tests, or to provide additional support and instruction to test-takers who struggle with certain concepts.
Item discrimination: Guttman scaling can also provide information on the ability of each item to discriminate between test-takers of high and low ability levels. Items that are highly discriminating are those that are more likely to be answered correctly by test-takers who have a strong understanding of the underlying concept, and more likely to be answered incorrectly by test-takers who do not.
Item bias: Guttman reports can also be used to identify potential sources of bias in the test, such as items that are more difficult for certain groups of test-takers (e.g., based on gender, race, or socioeconomic status). This information can be used to adjust the test or to provide additional support to test-takers who may be unfairly disadvantaged by certain test items.
Item guessability: Guttman scaling can help to identify items that are easily guessable. These are items that are more likely to be answered correctly by chance or luck, rather than through a deep understanding of the underlying concept. Identifying guessable items can help to improve the overall validity and reliability of the test.
Ceiling and floor effects: Where a large number of test-takers answer a test item correctly (a ceiling effect), or where a large number answer it incorrectly (a floor effect), this may suggest that the item is not differentiating between test-takers of varying ability levels.
Item redundancy: If two or more test items are highly correlated with one another, this may suggest that they are redundant and could be removed from the test without significantly impacting its ability to measure the construct being tested.
Dimensionality: Guttman reports can help to identify whether a test is measuring a unidimensional construct or multiple dimensions. If the items on the test are hierarchically ordered and form a unidimensional scale, this suggests that the test is measuring a single construct. If the items are not hierarchically ordered or form multiple scales, this suggests that the test may be measuring multiple constructs.
Test reliability: Guttman reports can also provide information on the reliability of the test, which refers to the consistency of scores obtained from the test. A reliable test should produce similar results when administered multiple times to the same group of test-takers.