Question summary report
The question summary report can be used to gain insights into the quality and effectiveness of individual test items and identify areas where test-takers may be struggling or excelling.
When a significant number of test-takers consistently answer a particular item incorrectly, it suggests potential flaws in the item itself, such as poor writing or ambiguity, or a need for additional instruction on the underlying concept. Conversely, if a substantial number of test-takers consistently answer a particular item correctly, it may indicate that the item is too simplistic or fails to adequately challenge the test-takers.
Run the report
To access the report, browse to Reporting > Reports.
Scroll down to General Reports and select Question Summary Report.

Make your selections from the filter page and then select Run Report.

The report displays. Let’s take a look at the components of the report displayed below.
- Click to jump to the text information about the report.
- Export the report to excel. You can download a sample excel spreadsheet to see what it looks like.
- Switch to the Guttman report using the same filter information used for the current Question summary report. View more about the Guttman report in this document.
- The Refine Report button takes you to the previous screen where you can make changes to the filters.
- The item number in the test.
- The item type, hover over the icon to reveal the type.
- The item stem. The items are links which when selected take you to the cohort summary. We’ve covered this in detail below.
- A count of the responses to the particular item, for that particular test.
- This is a percentage of the test-takers who have answered the item correctly.
- This is the same data as the previous column, but as a visual representation in a bar chart. The higher the percentage, the lighter the bars will display.
- This column lists the learning outcome for each item. We’ve covered learning outcomes in detail below.
- This column lists the % of test-takes who did not answer the item.
- The controls at the bottom of the chart provide options to increase the items that display per page, and navigation options.
Columns E, G, H, I, K, & L are sortable by selecting the header row.

View cohort summary
The items in the summary link to the Cohort summary which details the cohort results as percentages. In this example, 80% of the test-takers selected the correct response, Chlorophyll, no one selected Mitochondria and 20% selected Nucleus.

Learning outcome
Custom attributes linked to items display at the top of the Guttman report. This means that you can specify the values that display here. See our document on custom attributes to to learn how to create them.
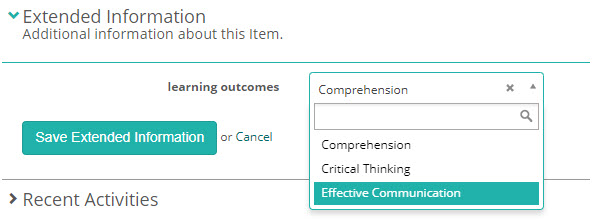
In the example below, we have created a custom attribute type of a ‘list’ and added three elements: Comprehension, Critical Thinking, and Effective Communication.

Before the learning outcomes display on the report, you will need to set them.
Navigate to Settings > Test Designer Settings > Test Authoring Settings and select your Custom Attribute for Learning Outcome.

Once you have set the learning outcome, they will display on your item in the Extended Information expandable. Select the relevant option and save.
Once you have completed these steps, this column will display on your report.