Customisable Reports
Introduction
Customisable reports provide the ability to create and run detailed reports on key components of the Janison Academy system.
To create a report:
- Select the entity you wish to report on, e.g. Users.
- Optionally apply a filter to define parts of that entity, e.g. users with the role of Basic User who are also inactive.
- Select the information that you wish to see, e.g. names and email addresses, and optionally change the order that this is displayed.
- Run the report and view its results.
- Optionally name the report and save it so that you can run it again later.
- Optionally save its results in various formats, e.g. as a Microsoft Excel file.
There is also an option such that when a report is run it pauses to allow a filter value to be entered on the spot, see Filter Items.
Thus, a report is actually a compilation of instructions: a set of filters applied to a particular component of the system or entity and a selection of the information in that entity to be displayed. When you run the report, the results are shown on the screen and can be saved. The report itself can be named and saved so that it can be run, and optionally edited, later on.
Note that not many users are authorised to use the Customisable Reports tool, so they would not see this menu item. Thus reporting is ‘wired’ into Janison’s Security framework, which ensures that users cannot see information that they’re not authorised to see.
The key features of Customisable Reports are:
- Sophisticated filters, including Custom Attributes with limitations.
- Selection of the details to show, including Custom Attributes.
- In-grid view of data.
- Exporting of the report results to Microsoft Excel and Adobe PDF file formats.
- Saving and modifying the report for re-use at a later date.
- Security.
- The use of Excel Templates to order the data reported.
To access Customisable Reports navigate to Manage Learning > Customisable Reports. You will see a list of previously saved Reports.

Settings
There are several settings available for making options and fields available.
The Settings button is available on the details view of customisable reports or from Settings > Reports
Note that the settings option is only available to administrators or authorised users.
Available setting options
The following options are available in the settings:
| Option | Description |
| Enable Excel Template based reports | When enabled will make the template available on the Custom Reports UI |
| Enable Private Reports | This will add the option to save the scope of the report with ‘Me’ |
| Enable selective sharing of reports | This will add the option to save the scope of the report with ‘Me and Others’, ‘My Organisation’, and ‘My Organisation Unit’. |
| Enable ordering of groups for User and Enrolment Entities | This will force the Group column to display in alphabetical order based on the Group Name, which may introduce a performance hit to the report. |
| Enable Enrolment Question Set reporting for Learning Event Session Attendance entity | Enables question sets applied at Enrolment and Session level to be included in the ‘Learning Event Session Attendance’, entity report which will introduce a performance hit to the report. |
| Enable Inactive Custom Attributes in Reports | Enabling this setting allows you to report on inactive custom attributes with historic data. Note this does not affect how sets function. |
| Enable Pipe Delimited file format export options | Enabling this setting allows you to export from Custom reports & Scheduled tasks with Pipe Delimited separations as a .txt file. |
Enabled entity types
This section allows you to control whether entity types are available for selection when creating a report.
The available entity types include:
|
|
|
Mandatory Filters
This section contains three fields that can be made mandatory including:
- Answer
- Test Attempt
- Test Attempt Section
Create a Custom Report
There are two ways to create a new Report: you can create one from scratch or you can refine an existing Report and save it as a copy, see Inspect a Custom Report.
Creating report
To create a new Report:
- Access the Customisable Reports screen then click the Create a Report button.
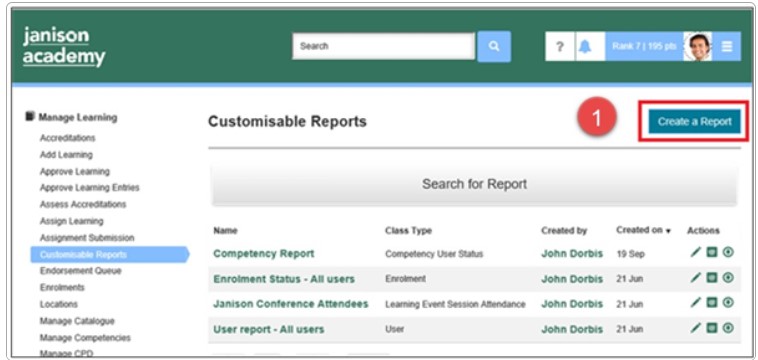
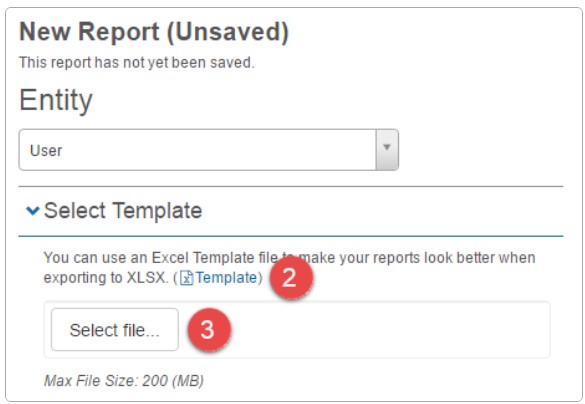
The New Report (Unsaved) screen displays.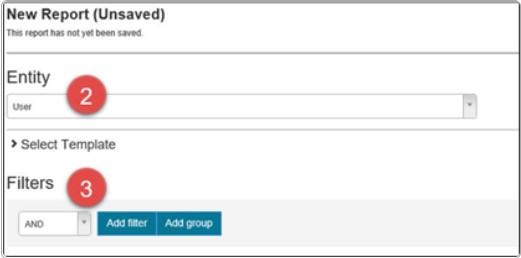
- Click in the Entity field and select the Entity from the drop-down list of options. You can only select one entity at a time.
- Build Filters to apply to that entity, if desired. See Notes on building filters for instructions.
- In the Select Columns section, select the columns that you want included in your report. The options that you can select are different for each entity.
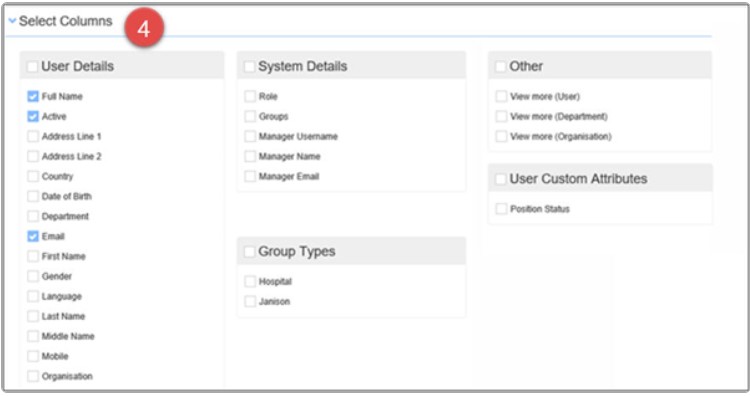
Note: These options also give you a useful sense of the information that is stored for each entity. - To customise the order of the detail rows, click the Set column order button.
Note: Only those columns selected in the Select Columns section display in the Set column order pop-up window.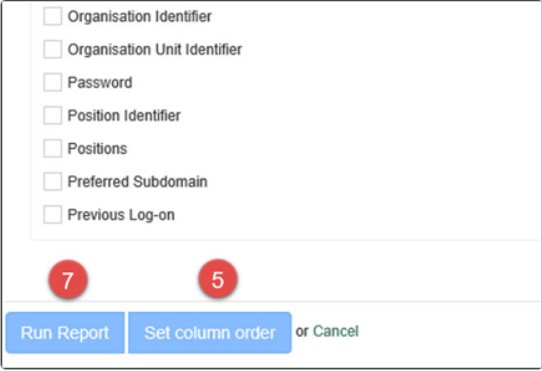
- Change the order by dragging rows up or down in the list.
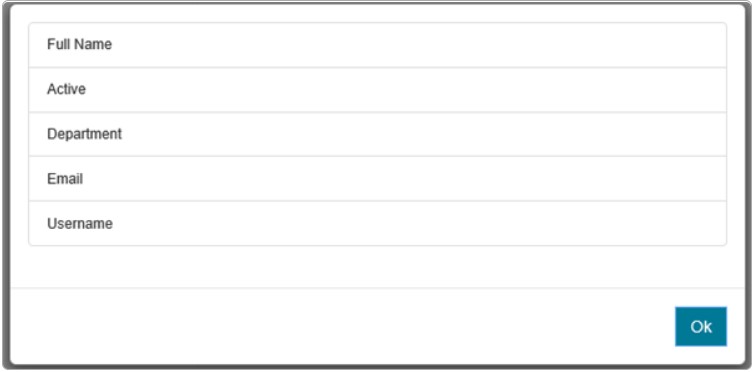
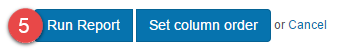
Click the OK button. - Click the Run Report button to generate the report.
Notes on building filters
You can set up rules to define parts of an entity that you want to report on. These rules are called filters here. They can be quite targeted and are combined using Boolean logic. This will be best understood by someone who is comfortable with:
- Boolean operations (AND, OR, NOT).
- Its language (e.g. “!” means “NOT”).
- How nesting these rules limits their scope.
Note that if this technical expertise is not available, an Export to Excel of the results of a report makes further filtering and data manipulation available in an application that most people are familiar with. This is a viable alternative to building a filter.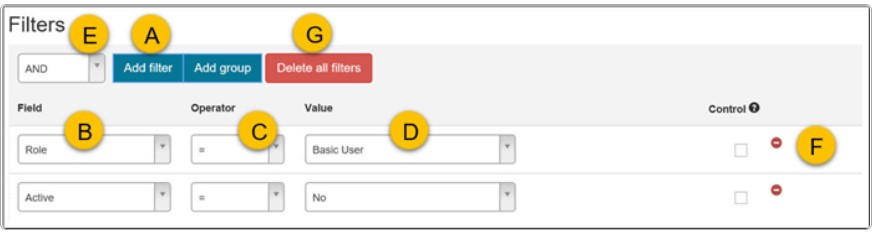
To build a filter as part of the report, at the simplest level you follow this process:
- Click the Add filter button to set up a rule.
- Click in the Field field, and from the drop-down list select the field to be used in the filter.
- Click in the Operator field and select the operator from the drop-down list.
- Click in the Value field and select a value from the drop-down list.
In other cases, for example when you have specified “Department = “, see O, an additional field displays. Click in the field and select either Const or Param as choices.
– Const indicates that you are specifying a value in the second Value field. Click in the second Value field to select the actual Org Unit.
– Param indicates that you are specifying a characteristic in the second Value field. Click in the second Value field and select a relationship, i.e. your own Org Unit. - You can add another rule, i.e. filter, to add to this top-level rule Group by clicking the top Add filter button, see A, again. Notice that this new rule (Active = No) lines up with the first rule. Depending on what is selected in the drop-down field at the top, see E, you are now specifying Users for whom both of these rules are true, i.e. AND, or else Users for whom either of the rules are true, i.e. OR. For example, in the image below the rule specifies Users with the role of Basic User who are also inactive Users, i.e. AND.
- To delete a single rule, i.e. filter, click the minus icon for that rule.
- To delete all the rules click the Delete all filters button.
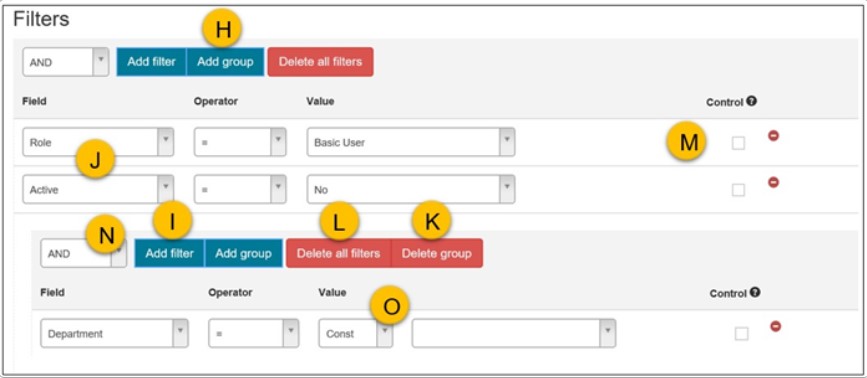
- You can further combine new rules into sub Groups by clicking the Add group button. This makes it possible to build a complex set of filters but this does require a technically oriented person.
- After you have clicked Add group, see H, new fields and buttons display. You can then click the local Add filter button to start creating a new rule Group made of logical combinations of rules. In the example above, the rules will be logically combined using AND, see N, that is, they must all be true for the whole Group of rules to be true.
- The outcome of this rule Group will be logically combined with the other rules listed just above it, i.e. those rules at the same level. This functionality, which can be repeated and combined numerous times and ways, means that rules can be nested in rules that are nested and combined in rules, and so on, leading to highly detailed specifications. As discussed, these are best set up by people, such as programmers, who can design the nested IF statements require.
- To delete a group of rules click the Delete Group button.
- To delete all the rules, i.e. filters, in a Group click the Delete all filters button.
- If you want the report to pause when it is run to allow this value to be entered by the user, select the Control checkbox next to a rule.
Filter Items
A Filter item takes a Property (Field), an Operand (Operator) and a Value to compare with. The Property is either a property available directly on the entity, e.g. User’s Last Name, or a Custom Attribute. The following properties are available to participate in filtering at the user level. Note that for brevity, standard built-in properties are not included. If the field value is:
- Organisation. Click in the Value field and select the organisation name.
- Org Unit. Click in the Value field and select the organisation name.
- Role. Click in the Value field and select the role name.
- Last logged on, Last Active, Created. Click the Calendar icon in the Value field and select the date related to the user’s account and activity.
- Custom Attributes – note that it’s possible to specify filters against custom attributes, including Boolean values, string values etc. This makes it possible to create reports targeted at specific demographics.
Operands (Operator)
Operands are the logical operations. Depending on the data type of the Filter Property, different operands are available. For example, ‘contains’ cannot operate on a Date Type, but it can operate on a Text String. Below are the operands available:
- = – Equals, available on all data types
- != – Does Not Equal, available on all data types
- Less than
- Greater than, available on String (alphabetical order) and Numerical types
- Contains – Contains operator, only available for Text String Data Type
- Doesn’t contain
- Start with
- End with
- Is null
- Is not null
- After – Same as Greater than operator for Data Type
- Before – Same as Less than operator for Data Type.
Value to compare with
The Value to compare with appears in the third column, and changes its input control depending on the data type. For example, for Date Types, it would show a calendar icon, and for Text, it would show a text box. This is the value that the report will use in the filter item to compare with.
Parameters
Some data types support parametric comparison values rather than explicit values. For example, it’s often useful to run a report of users that logged on during the last week. Rather than selecting a ‘hard’ date (which would need to be updated each time a report is run), it’s possible to select a parameter: “during the last week”. At the time of writing, parametric comparison values are only available for Date Type properties. Some examples:
- Today
- This Week
- This Month
- This Year
- Yesterday
- Last Week
- Last Month
- Last Year
- Days from now
- Weeks from now
- Months from now
- Years from now
Security filtering
Note that in addition to the filters specified by the user creating the report, the system will append further filters based on Security roles. This makes the customisable reporting functionality available to a wider range of users as it doesn’t need to be restricted to administrator users. It also leverages existing security settings about who can see whom i.e. no special or separate configuration is required for a Supervisor to see just their staff, or a Teacher to see just their students. It makes it impossible for someone to accidentally be granted too many permissions at the reporting level and improves performance, as most users will only be able to see a subset of total results. The security filtering applied is the same as for the User List Form, under Manage Users menu item – the same Security filtering also applies to reports on enrolment entities.
Schedule a Report
There are two options to schedule reports. These include:
- Schedule to email
- Schedule to file
You can schedule reports to run at a specific time or at regular intervals.
Schedule to email
Go to Manage Learning > Customisable Reports
- Select the
 icon next to the required report.
- Ensure the report schedule is enabled
- Job Type is system generated and cannot be changed
- Select a Report Name.
- Enter an Email address. For more than one address, insert a semicolon between addresses.
- Select a file format. The options are CSV, PDF or Excel.
- Select a Run From date and time.
- Optionally set a Run To date and time.
If the schedule type you select is at a regular interval, you would not typically set an end date as the options set there would determine the end date. - Select a Schedule Type. The options are At a regular interval or At scheduled times. Additional options will be displayed depending on the option you select.
At a regular interval
If the report is set to run at regular intervals, the following step are relevant.
- Run Indefinitely. If this option is selected, the run count field becomes inactive.
- Run Count. This will determine the number of instances the report will run for. e.g. 3
- Select a Unit. The options are minute, hour, day or week.
- Select a Frequency. This will determine how often the task will run.
At scheduled times
If the report is set to run at scheduled times, the following step are relevant.
- Select a Time Zone.
- Select the Time of Day.
- Select a Frequency. The options are every day, Monday to Friday, Monday to Saturday or specific day. If specific day is selected an additional option will appear to select the day.
Schedule to file
You can also schedule your report to be placed on a location on the network. This may be used for third party systems such as a HR system to access user data.
Selecting the  icon will direct you to the Schedule a Job screen The Job type selected will be Export custom report to file.
You will need to contact a customer support representative to provide you with access to this location.
Using Custom Report Templates
To upload a customisable report template, enable Excel Template based reports in (Settings > Reports).
You can use an Excel template to sort, count, total or average data and add charts to your report. You will need Excel skills to build the template.
The example below is based on the sample template available in the system, which uses a chart to display a count of genders.
Note that for the template option to become available, the setting needs to be enabled. You can read more about this topic in our document on customisable report settings.

Prepare your template
Steps to access the template are below. There are three tabs that require input; data template, raw data and chart.
Data template
This is the tab where you input the data you intend to have on your report.
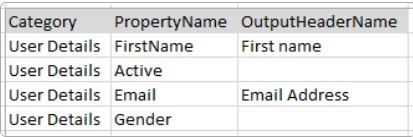
Category is the column header, options are User Details, System Details or Other.

PropertyName are the fields of the columns. Spaces must be removed, for example as can be seen in First Name.
OutputHeaderName – you can customise the value of the PropertyName. Populating this column is optional.
Raw Data
This is the tab that will be populated with the data when the report is run. The columns are the PropertyNames from the data template tab.

Chart
This is the tab where you can add a pivot table and charts based on the raw data.

Create a report with a template
- Select Create Report.

The New Report screen will be displayed.
For this example we are going to use User as the entity. The template is based on this entity.
- Download the template and populate it with the relevant data as described above.
- Select your file to upload the template.
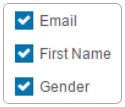
- Select the required columns. In this example we will select the columns used in the template file; Active, Email, First Name and Gender.

- Select Run Report.
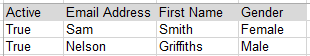
The results will be displayed on-screen.
- Select Export.

An excel file will download.
The raw data tab will be populated with report data.
The chart will be populated with this data.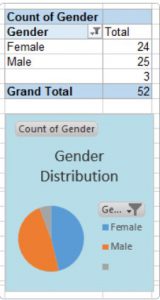
Report APIs
Administrators can create an API for a customisable report.
Note the following pre-requisite:
- The custom report used as the basis for the report API must have been created before the report API can be created.
To create a report API
- Navigate to Manage Learning > Report APIs.
- The Customisable Report Apis screen will display. Select Add Customisable Report Api.
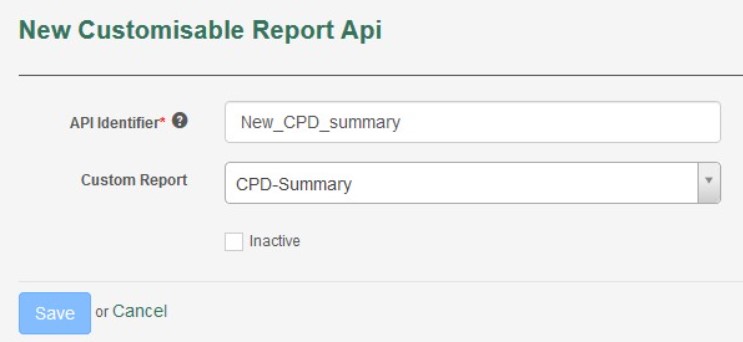
- The New Customisable Report Api screen will display. Enter an API identifier – this can only contain alphanumeric characters, hyphens (-) and underscores (_) and will also be the filename of the report API.
- Select the required custom report from the list.
- Leave the Inactive checkbox blank. This can be used to deactivate a report API, if needed.
- Select Save to create the report API, or Cancel to exit this screen without saving.
- The Customisable Report Apis screen will display, with the newly created report API listed.
To view or edit report API
Once created, you can view the details of a report API and edit these as needed.
- On the Customisable Report Apis screen, select the required report API from the list.
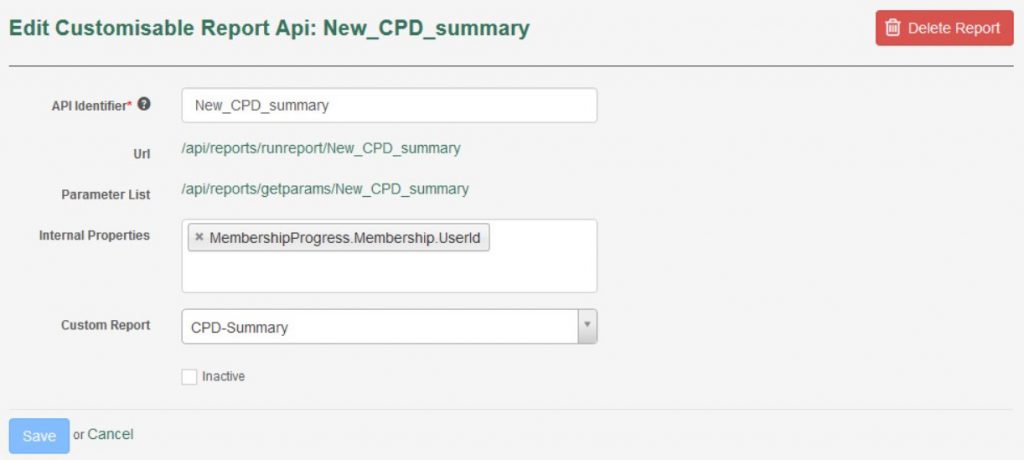
- The Edit Customisable Report Api screen will display. It contains the following sections
- API Identifier – The name and filename of the report API.
- Url – The endpoint URL for the report API. Select the URL to view the XML document tree output in your browser.
- Parameter List – The endpoint URL for the parameters that can be included in the report API. Select the URL to view the XML document tree output in your browser.
- Internal Properties – Any required additional internal properties to be included in the report API can be selected here.
- Custom Report – The custom report the report API is based on is shown here. If the wrong report has been chosen, select the correct custom report here.
- Inactive checkbox – The report API can be deactivated but retained by selecting this checkbox.
- Delete Report – Select this to delete the report API if it is no longer needed. You will need to confirm the deletion. Note that deletion is final, so consider deactivating via the Inactive checkbox instead, if the report API is not currently needed but may be needed in the future.
- Select Save to save any changes, or Cancel to exit without saving.