Candidate dashboard
The candidate dashboard is where test-takers who sign in to Insights find their tests. They start or resume a test from it, try practice tests, and see their results and feedback once they're released.
What the dashboard shows
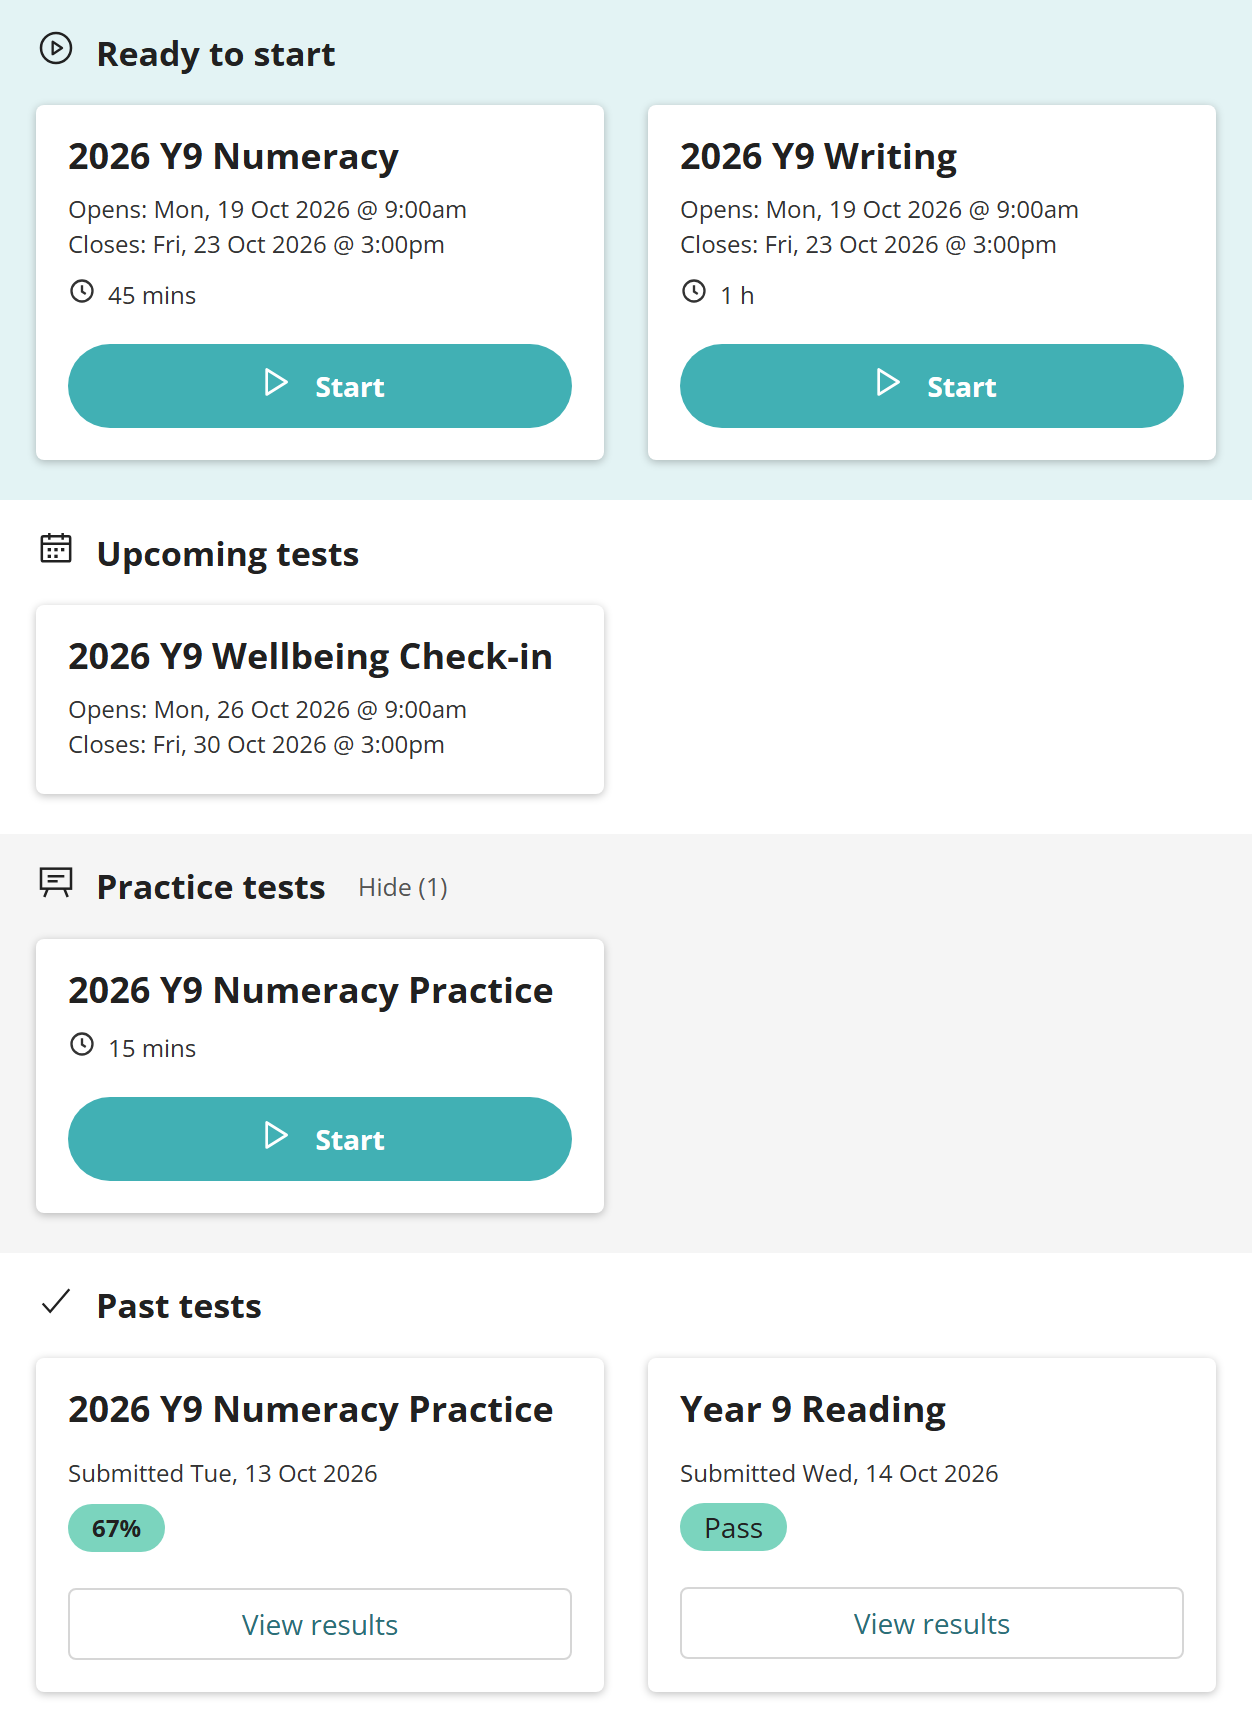
When test-takers sign in, the dashboard lists their tests in sections:
- Ready to start — tests they can start now, and tests they've started but not submitted
- Upcoming tests — tests they're enrolled in that haven't opened yet
- Practice tests — every published example test on your site, which Hide and Show collapse and expand
- Past tests — tests they've submitted, with the result once it's released.
Administrators can hide the Upcoming tests, Practice tests and Past tests sections. See Settings. On sites that use Janison Remote with onboarding switched on, the dashboard also shows the test-taker's onboarding status and their onboarding tests.
Note
Depending on your site's settings, Start opens the test in the browser or in the Janison Replay app. In the browser, test-takers can still reach other tabs and apps on their device. Replay locks the device down so they can reach only the test. See Janison Replay.
Ready to start
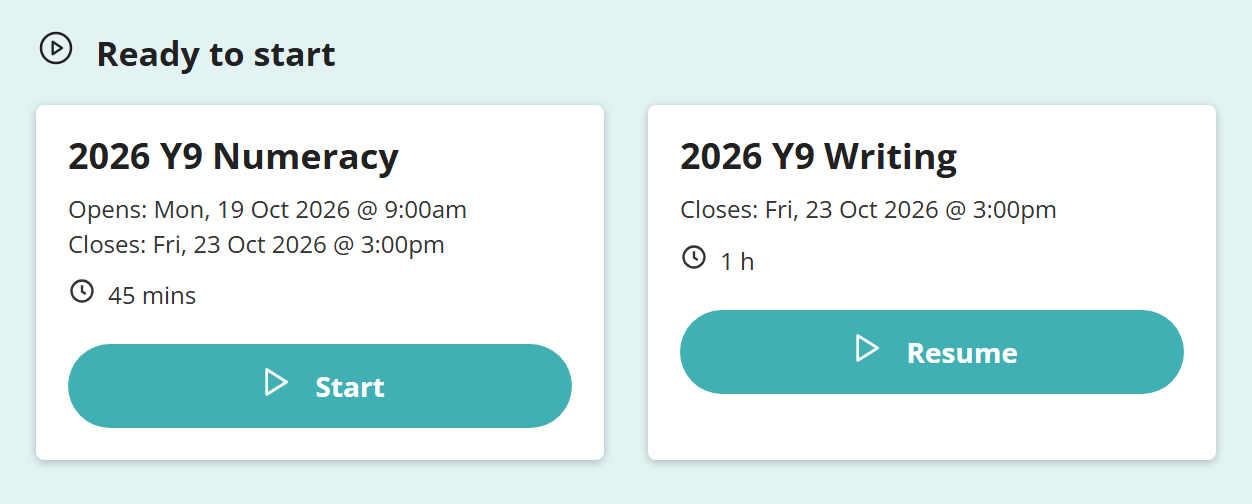
This section lists the tests a test-taker can start now, and the ones they've started but not yet submitted. Each tile shows:
- the test name
- when the test opens and closes, or the hours it's open each day
- its duration, if the test is timed
- Start, or Resume if the test-taker has already begun.
Once a test is submitted, its tile moves to Past tests. Where an assessment event requires payment, the test-taker has to pay before they can start its test. See Assessment events.
Upcoming tests
This section lists the tests a test-taker is enrolled in that haven't opened yet. They can't start these until the open date. On the open date, the tile moves to Ready to start.
Past tests
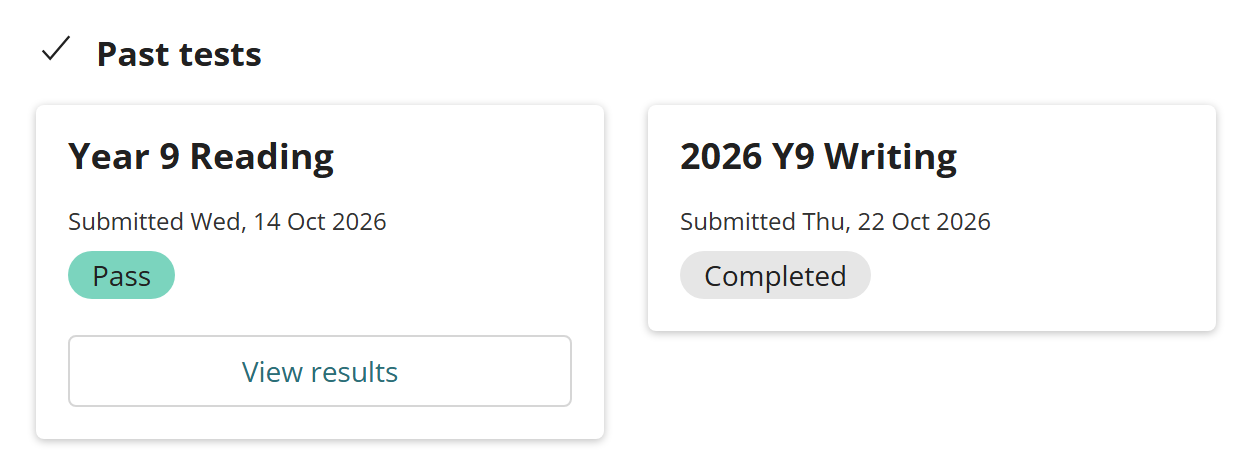
This section lists the tests the test-taker has submitted. Each tile shows the test name and the date it was submitted. Until the test has a result, the tile shows its status, such as Completed. Once it has a result, the tile shows it with a View results button.
A result appears only when all of these are true:
- the assessment event has Enable Results and Feedback turned on
- every response in the attempt has been marked
- the result has been released, where the event's marking holds results back for release.
See Assessment events for how each marking mode releases results.
How the result is shown
The result on a tile depends on how the test is scored. If the test has no pass mark or score bands, the tile shows the percentage, coloured by range:
- 0–24% red
- 25–49% amber
- 50–74% green
- 75–100% blue.

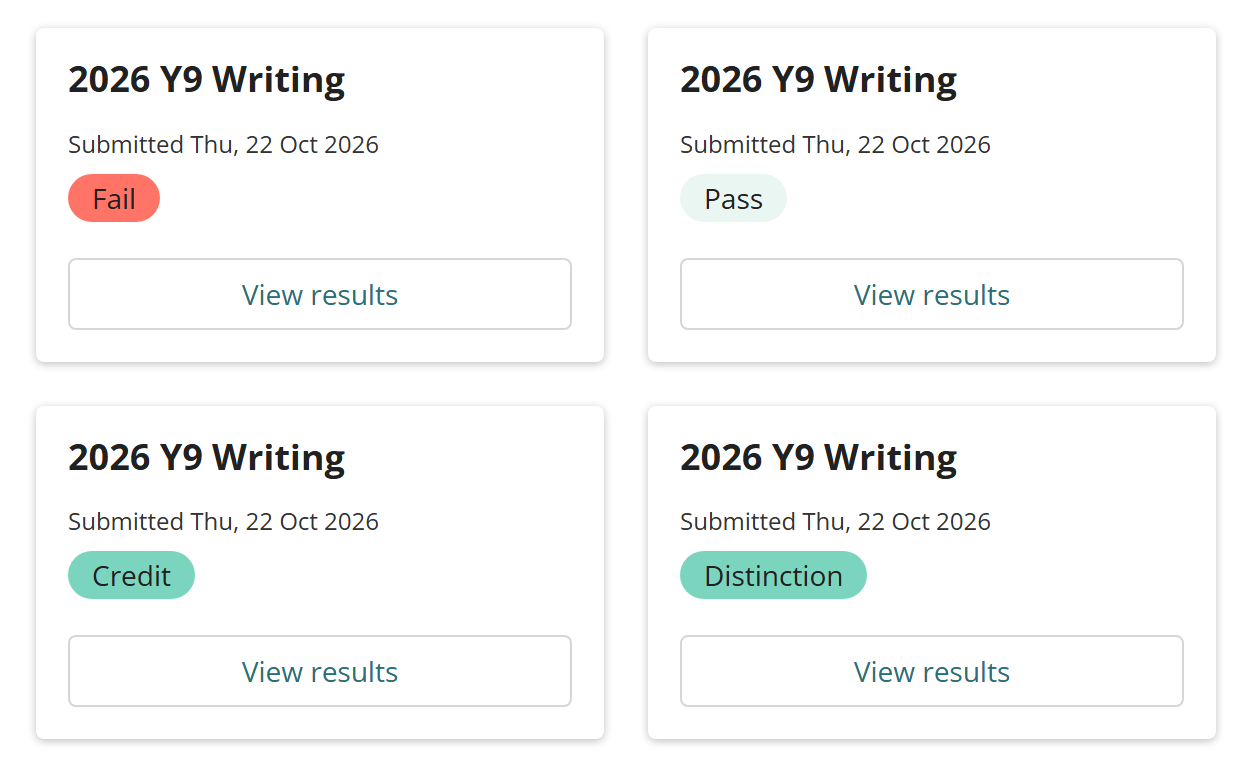
If the test has a pass mark, the tile shows Pass or Fail instead.
If the test uses score band tables, the tile shows the name of the test-taker's band, such as Fail, Pass, Credit or Distinction. Score band tables let an author name ranges of scores. See Create a test.
Either way, the label is red below the pass score and green above it. It's pale green when the score is exactly the pass score.
Results and feedback
Test-takers select View results on a past test's tile to open its results page. The page's layout depends on the feedback type your site uses, and one type applies to every test on the site:
- Show Formative Feedback — item by item. Test-takers see which items they got right and can open each response in the test player. It suits tests where seeing the items again isn't a concern, such as multiple choice practice.
- Show Detailed Feedback — a row of feedback and scores for each item or each learning outcome, without the items themselves. Manually marked items include the marker's feedback. It suits tests whose items must stay secure.
An administrator chooses the type at Settings > Test Delivery Settings > Test Feedback Settings.
Formative feedback
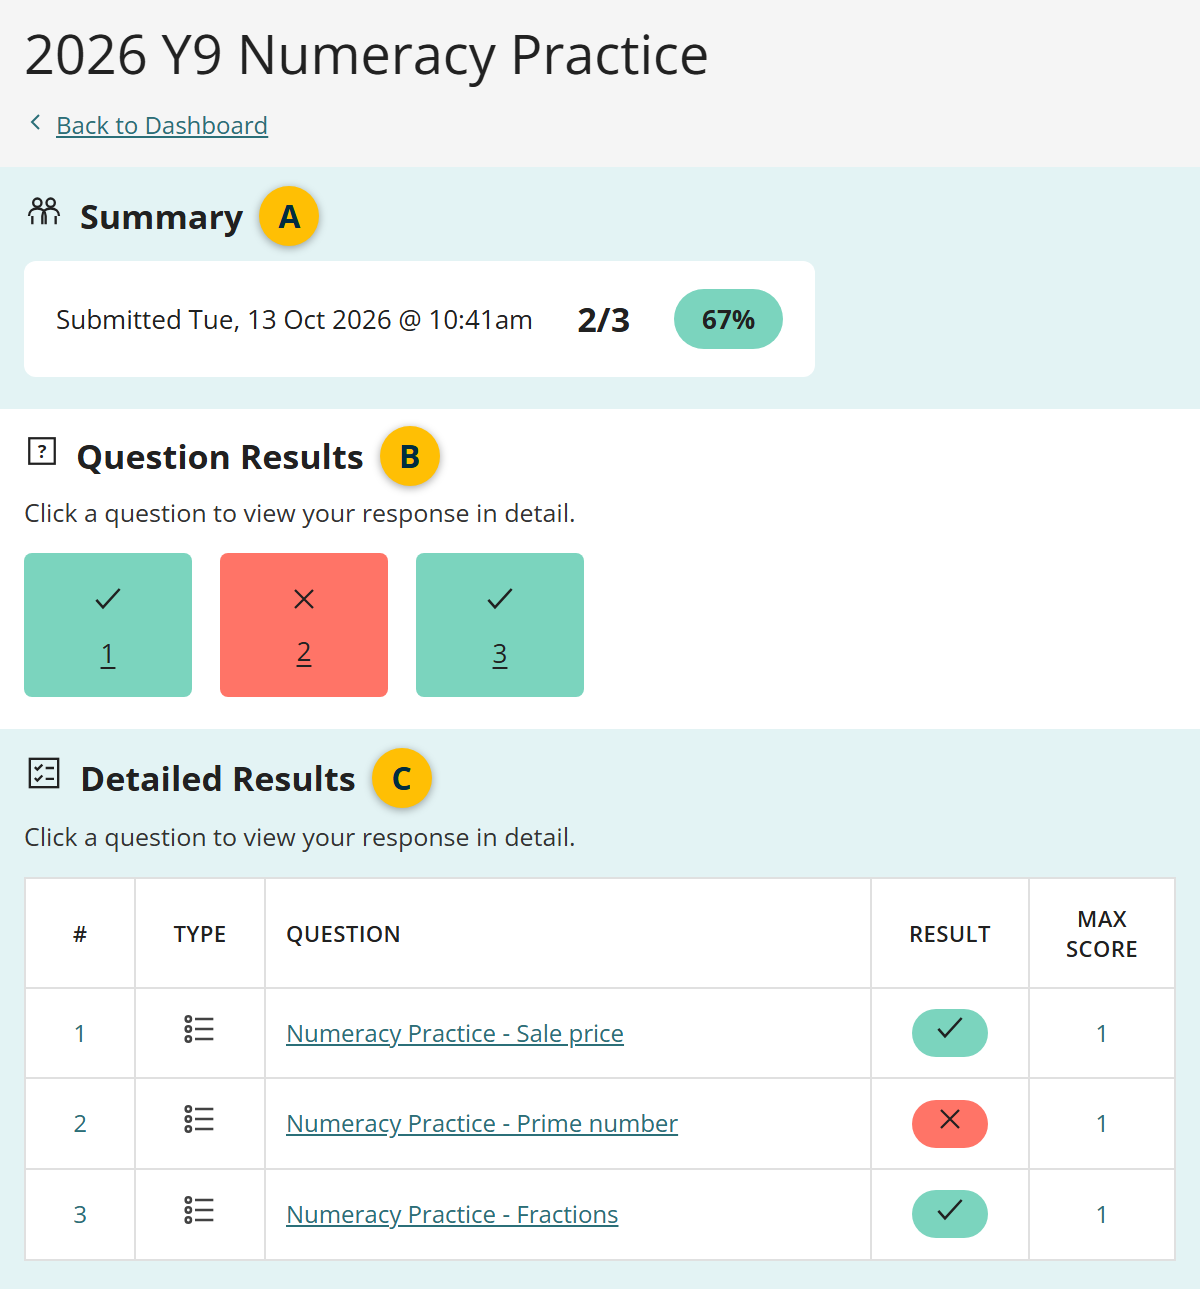
Formative feedback lets test-takers review each item with its feedback, so they can see the limits of their knowledge and how to improve. The page has three sections:
- Summary shows when the test was submitted, the score and the percentage.
- Question Results shows a tile for each item, marked right or wrong. Selecting a tile opens the test-taker's response.
- Detailed Results lists each item's number, type, name, result and maximum score. Selecting an item's name opens the response.
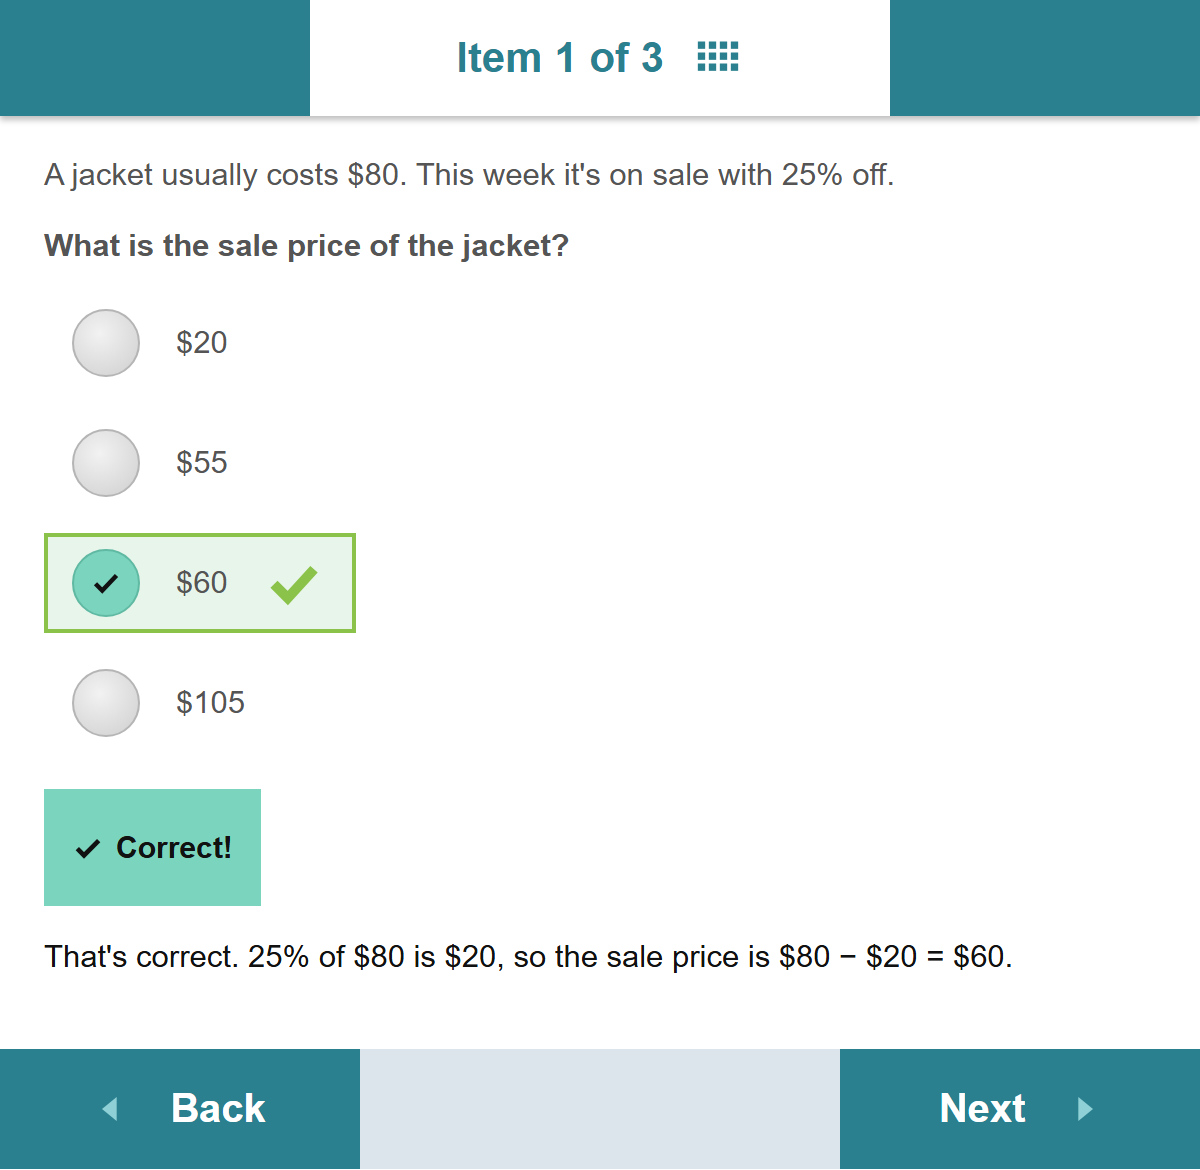
Selecting an item opens it in the test player with the test-taker's response. What else they see depends on how the item's author set up feedback and live marking. See Feedback and live marking.
Here, the test-taker answered the first item correctly:
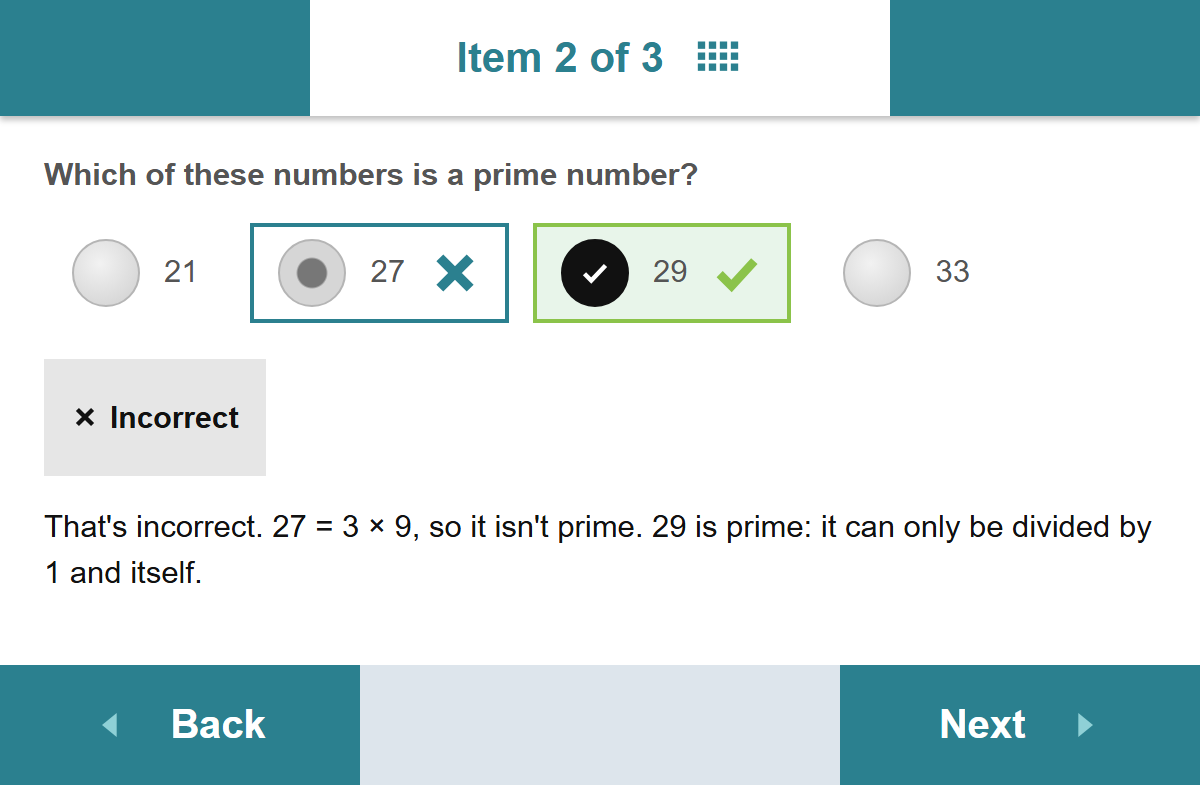
They answered the second item incorrectly, so the player also shows the correct answer:
Detailed feedback
Detailed feedback shows how the test-taker did against the goals of the test, rather than item by item, and can keep the items hidden. By default, each row is an item, labelled by its number. Your administrator can label and group the rows by a custom attribute, such as a learning outcome, instead. See Group rows by a custom attribute.
Detailed feedback appears only once every response in the attempt is marked. What each row shows depends on how its item is marked.
Manually marked items
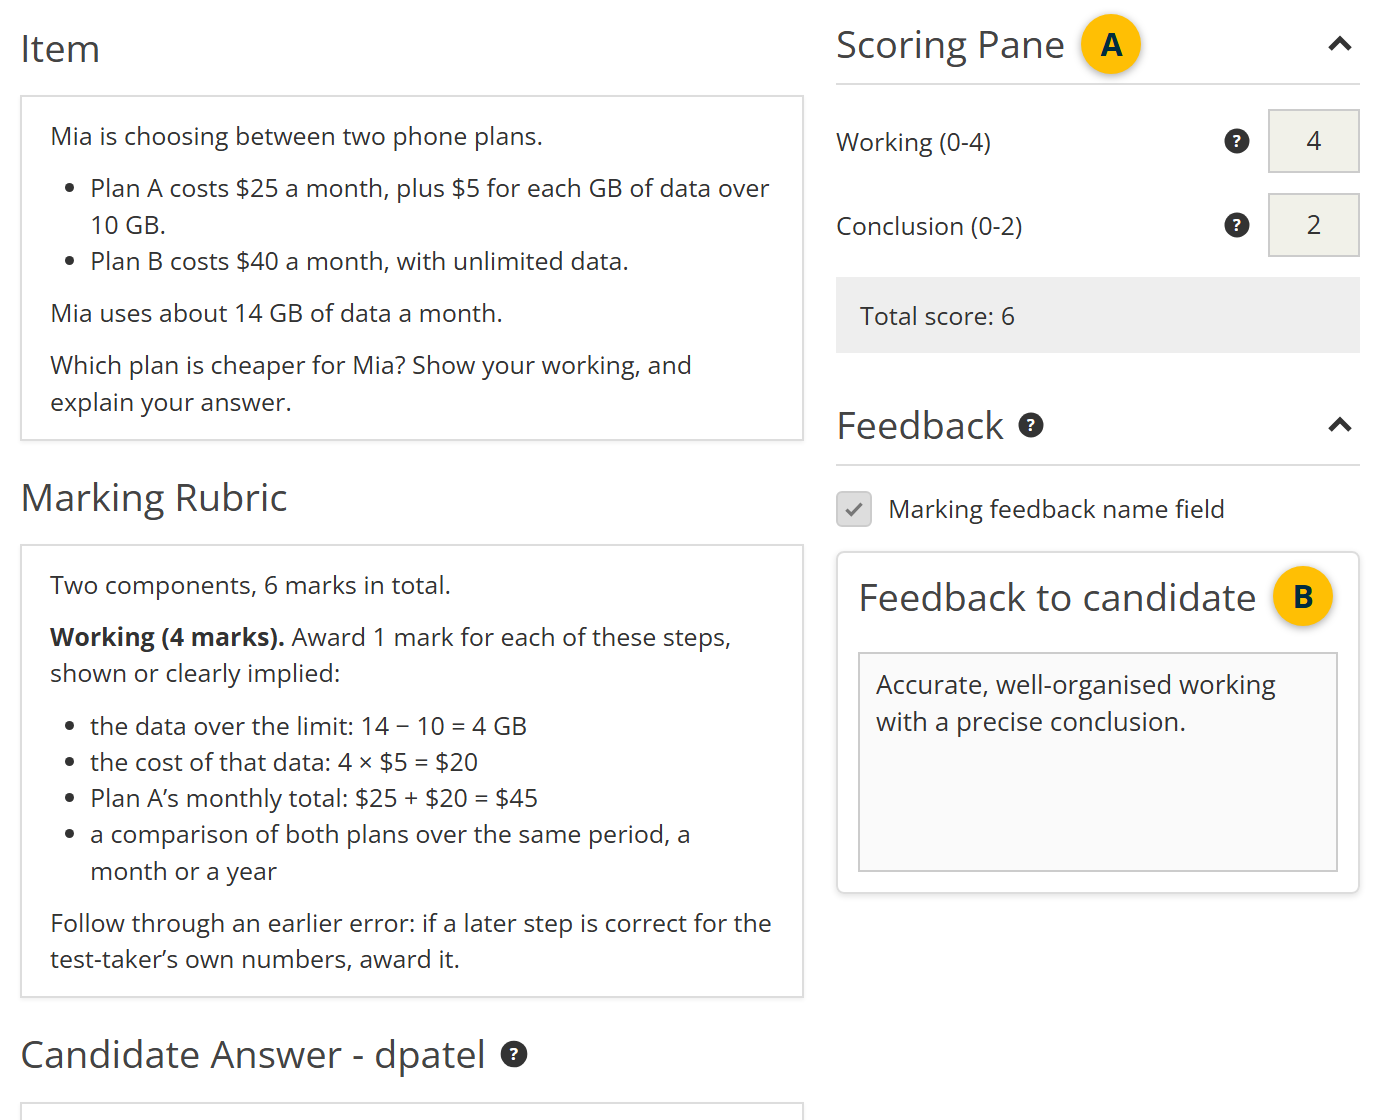
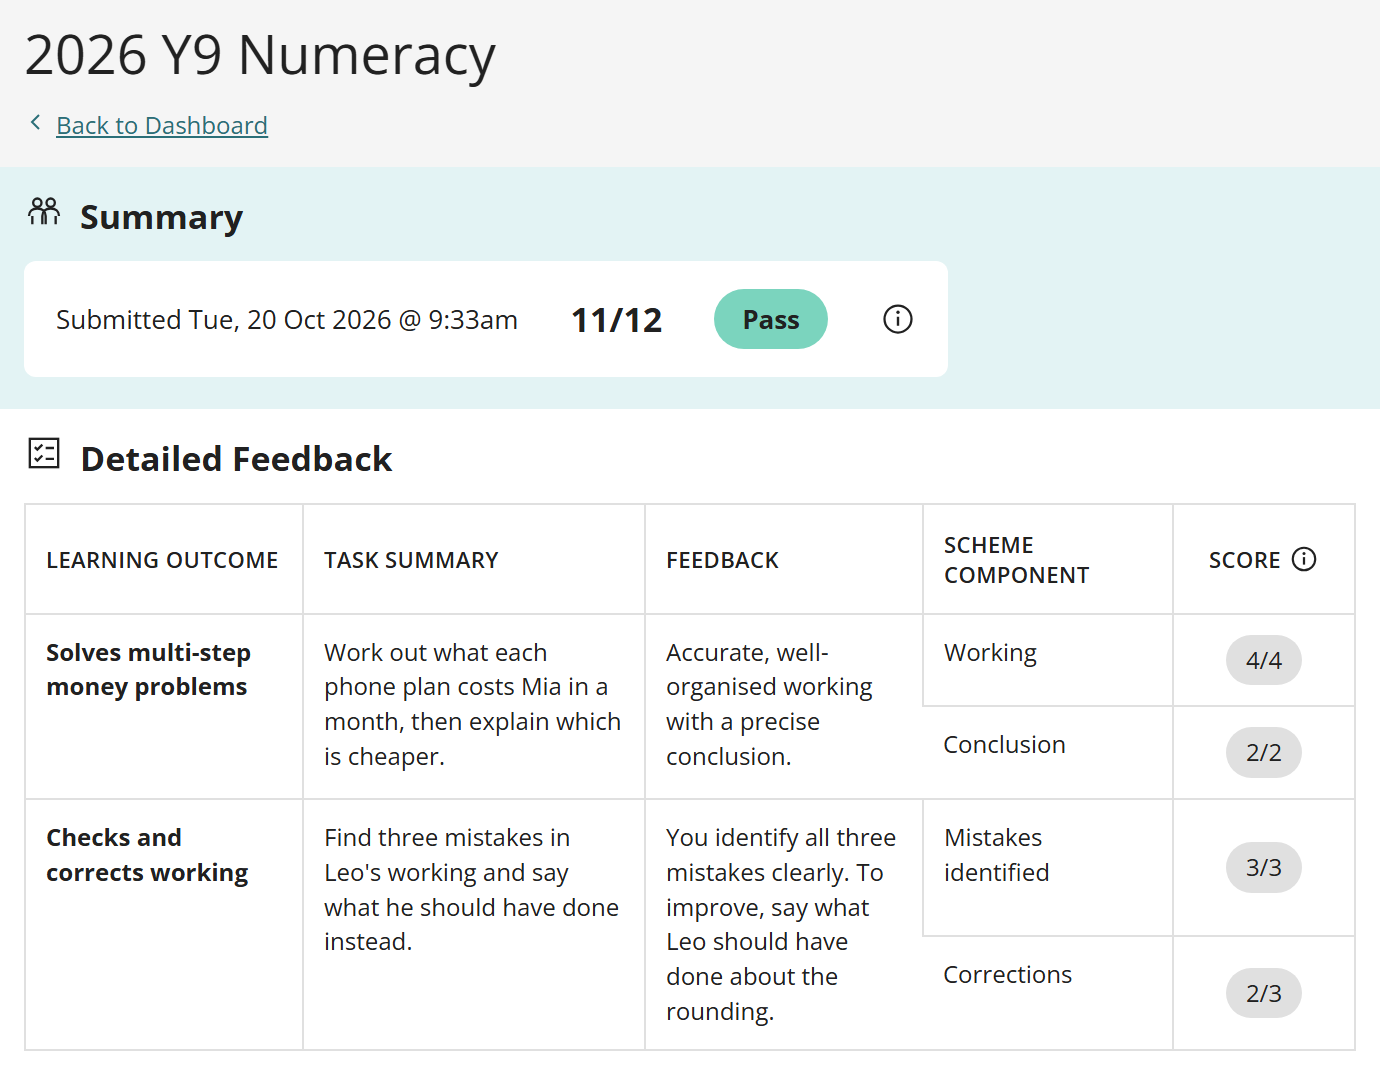
For an item a marker scores, the row shows the marker's feedback and the score for each component of the marking scheme. In the example below, 2026 Y9 Numeracy has two extended text items, each with two marking scheme components.
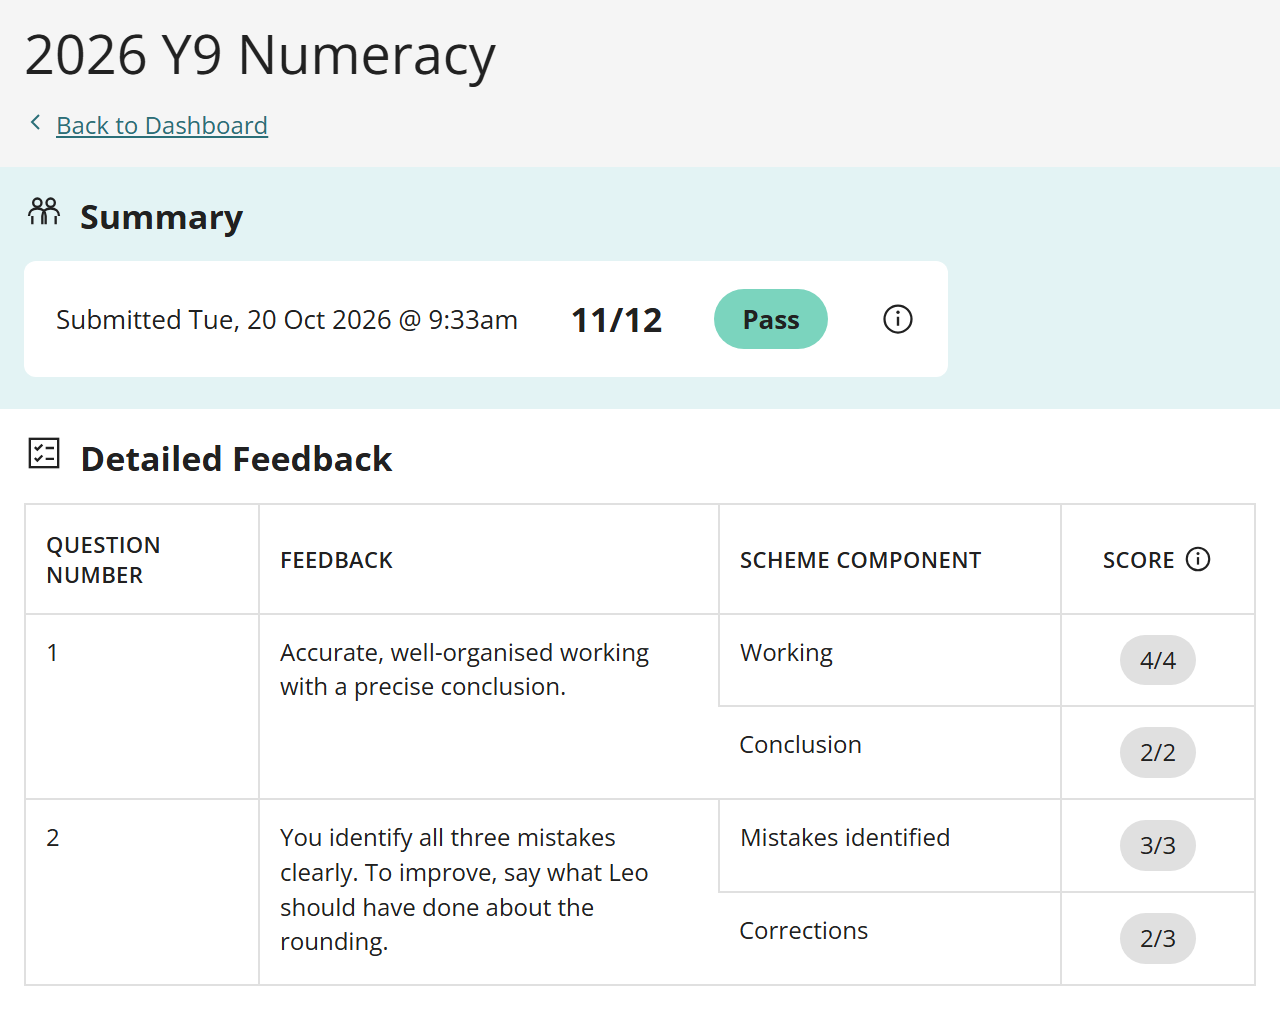
The feedback is what the marker enters under Feedback to candidate on the marking screen:
- Scoring Pane holds the marker's score for each marking scheme component.
- Feedback to candidate holds the feedback the test-taker sees.
Auto-marked items
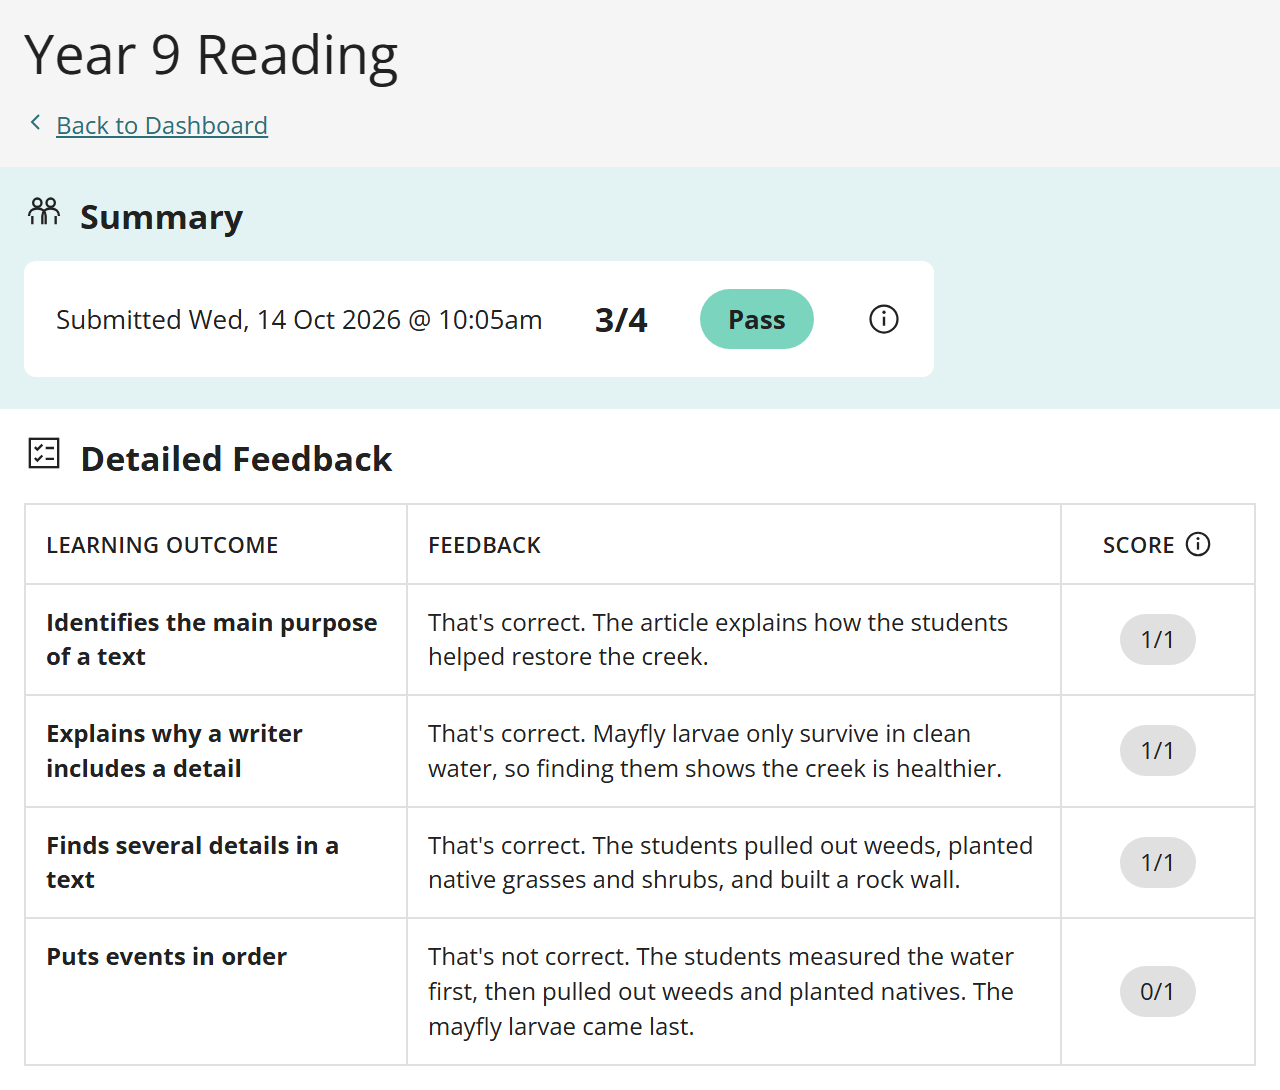
For an auto-marked item, the row shows the item's correct or incorrect response feedback, whichever matches the response. A partly correct response gets the incorrect feedback. Authors write this feedback in the item's Feedback and Live Marking section. See Feedback and live marking.
In the example below, Year 9 Reading has four auto-marked items. The first column shows each item's learning outcome instead of its number.
Group rows by a custom attribute
Two settings let item custom attributes shape the detailed feedback page:
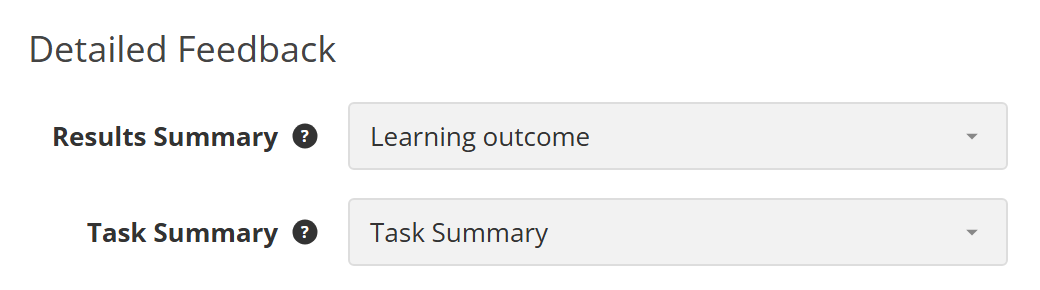
- Results Summary replaces the Question Number column with the custom attribute you choose. Items that share a value become one row, with their scores added together and their feedback combined.
- Task Summary adds a column showing the custom attribute's value for each item.
To set them up, first create the custom attributes and make them available on items. See Custom attributes.
Next, at Settings > Test Delivery Settings > Test Feedback Settings, choose the attributes under Results Summary and Task Summary. Both are available only when Show Detailed Feedback is selected.
Then, on each item, enter the values in the Extended Information section.
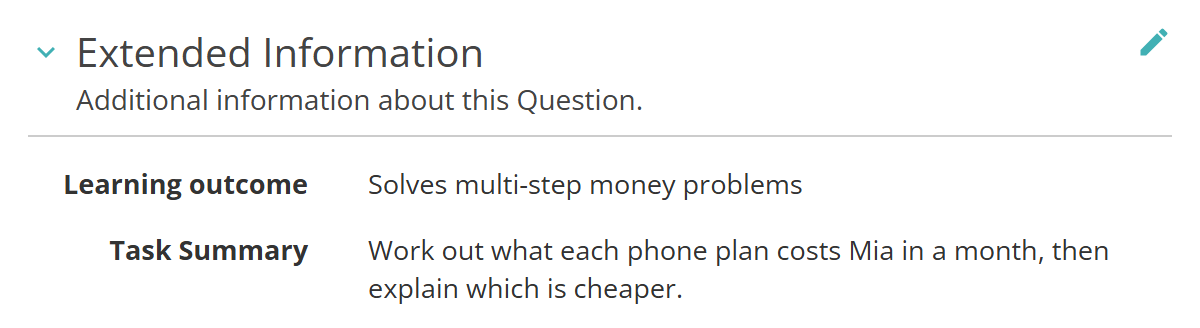
The detailed feedback page then shows the values in its first two columns:
Settings
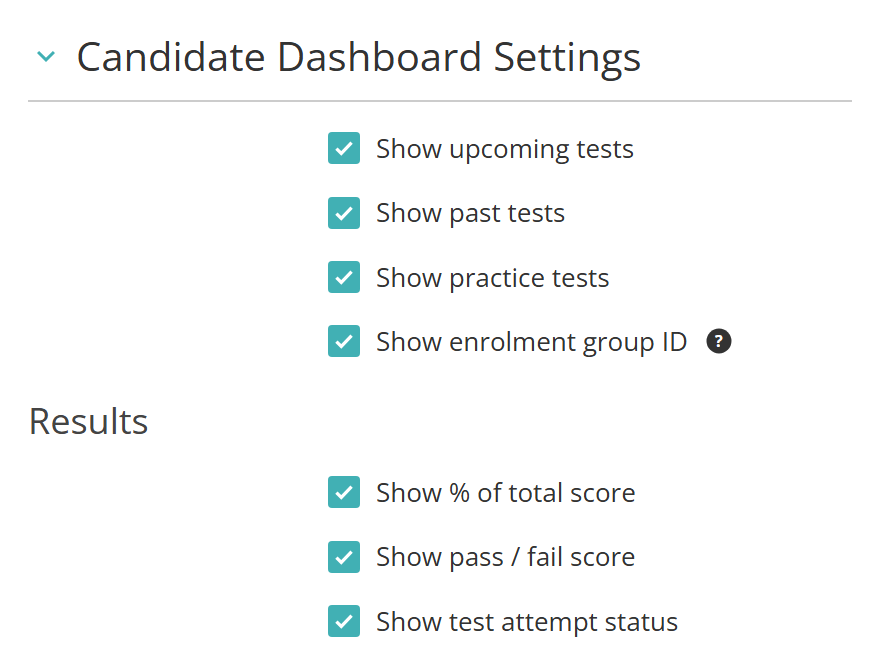
Administrators can configure the following settings at Settings > Test Delivery Settings, in the Candidate Dashboard Settings section. All are on by default except Show enrolment group ID.
Show upcoming tests — shows the Upcoming tests section.
Show past tests — shows the Past tests section.
Show practice tests — shows the Practice tests section, which lists every published example test. See Example or practice tests.
Show enrolment group ID — adds the ID of the group the test-taker was enrolled through to each tile.
Show % of total score — shows the percentage on past test tiles.
Show pass / fail score — shows Pass, Fail or the band name on past test tiles, for tests with a pass mark or score bands.
Show test attempt status — shows the attempt's status, such as Completed, on past test tiles that don't have a result yet.
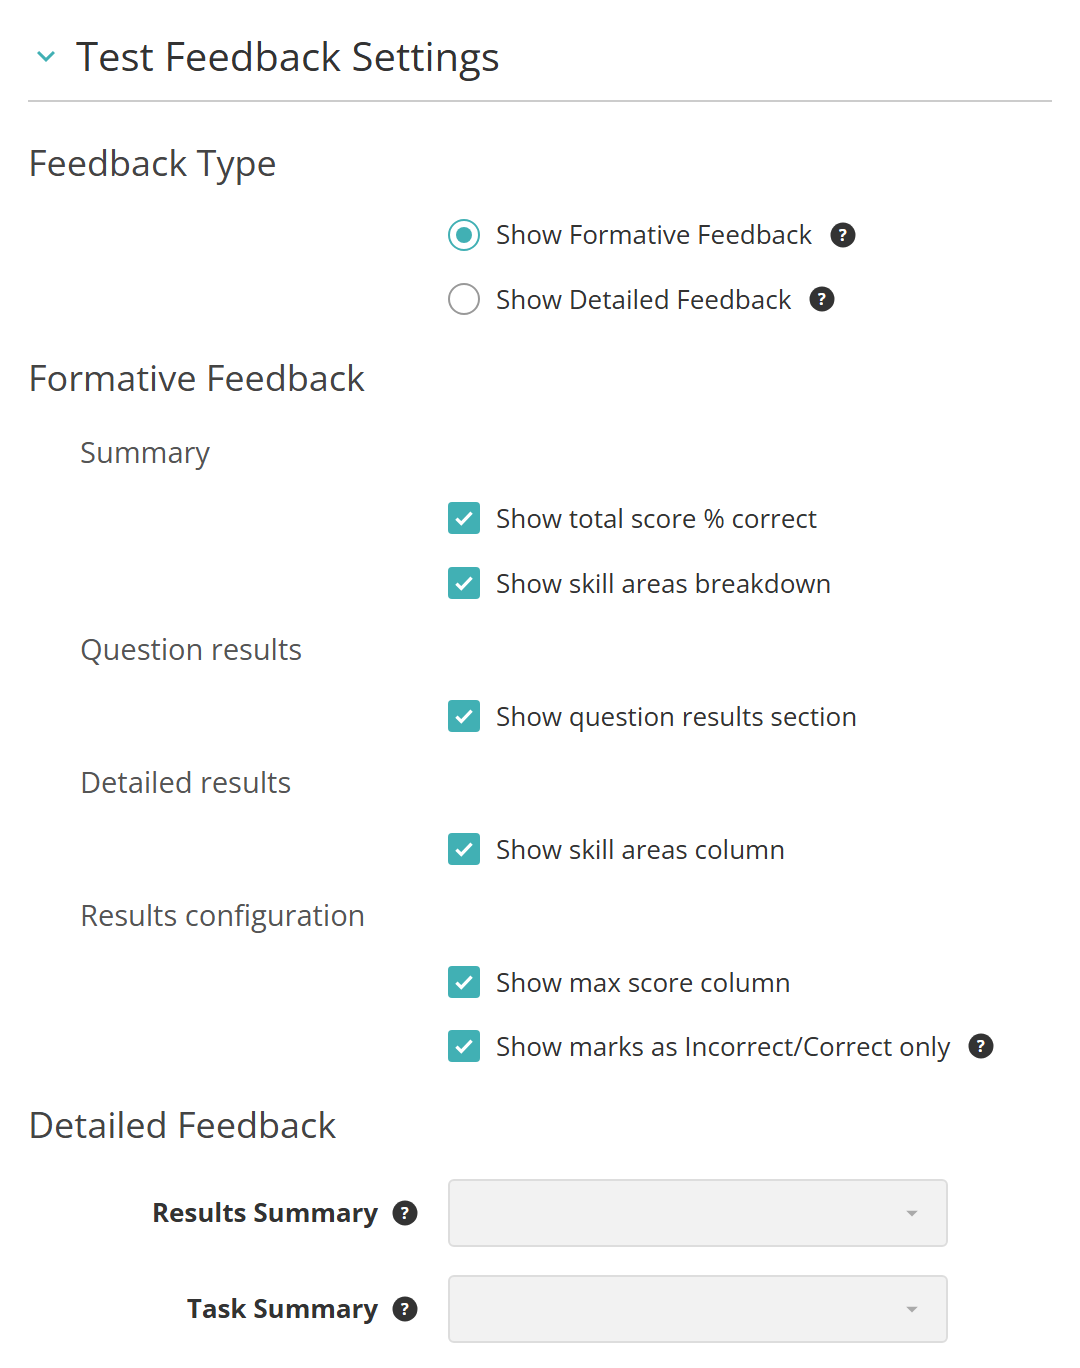
These are in the Test Feedback Settings section of the same page.
Feedback Type — Show Formative Feedback or Show Detailed Feedback. Formative is the default. Only the options for the selected type can be changed.
The formative options are all on by default:
Show total score % correct — shows the percentage in Summary.
Show skill areas breakdown and Show skill areas column — the results page doesn't currently show skill areas, so these have no visible effect.
Show question results section — shows the Question Results section.
Show max score column — shows the Max score column in Detailed Results.
Show marks as Incorrect/Correct only — shows partly correct responses as incorrect in Question Results and Detailed Results.
The detailed options:
Results Summary — the item custom attribute that labels and groups the rows. See Group rows by a custom attribute.
Task Summary — the item custom attribute shown in an extra column.
Settings elsewhere also affect the dashboard:
Enable Results and Feedback — on each assessment event, lets its test-takers see results and feedback on the dashboard. See Assessment events.
Enable Test Score Band Tables — at Settings > Test Designer Settings, lets tests use score band tables.
Enable Replay lockdown and Enable Replay Auto-Launch — at Settings > Test Delivery Settings. With both on, Start opens the Replay app. An event with Force Replay Lockdown cleared, or a test-taker with the Exempt from secure browser adjustment, uses the browser instead. See Janison Replay.
Enable payments for enrolments — at Settings > Assessment Event Settings, lets events require payment before test-takers can start. See Assessment events.