Invigilator dashboard
The invigilator dashboard summarises test delivery for an org unit: the sessions running today, the assessment events being delivered and the test-takers sitting them. It's also where you create test sessions and find your Janison Replay PIN. To open it, select Deliver > Invigilator Dashboard.
Important
What you see depends on your role. Each section, and the Create New Test Session button, is a separate permission, so you may see fewer sections than this page describes. The screenshots show an administrator's view.
Choose an org unit and see today's sessions
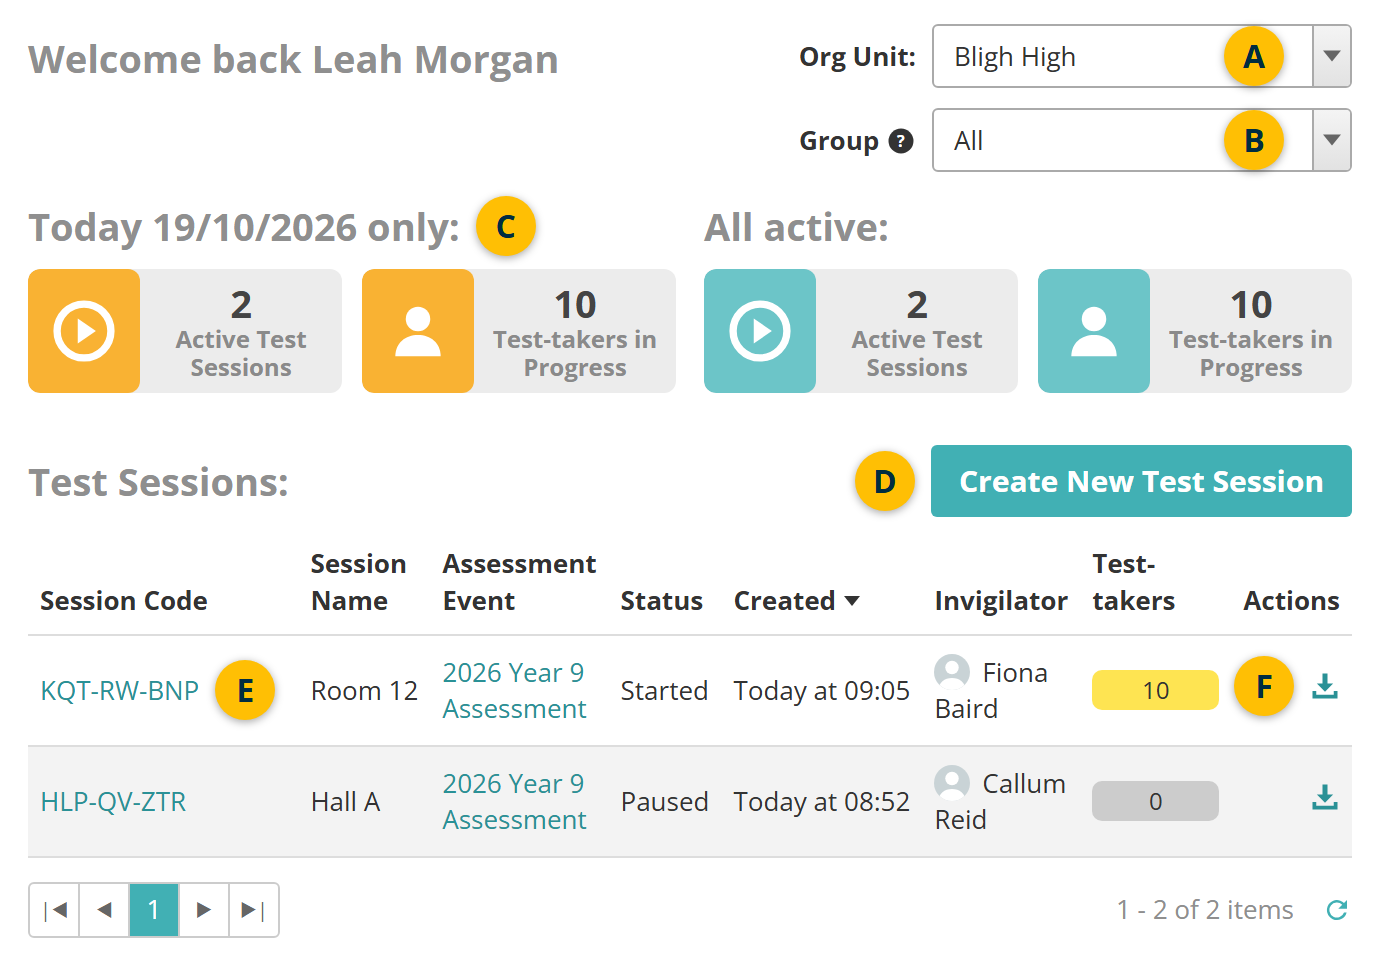
The top of the dashboard sets what the rest of it shows, and lists today's test sessions.
- Org Unit chooses the test centre. It lists the org units you can see, plus All unless your site has removed that option.
- Group narrows the assessment events, the test-takers list and the test-taker counts to one group's members.
- The counts show how many sessions are active and how many test-takers are sitting a test. See Counts.
- Create New Test Session creates a session. See Create a test session.
- Select a session code to open that session's administration page.
- The download icon saves an Excel workbook about the session. It lists the session's details, then each test-taker's times, one-time code and personal needs and preferences (PNP) codes.
Counts
Today date only: counts the test sessions active today, and the test-takers who have started a test today. All active: counts every open session and every test-taker with an open attempt they've started, whenever they began.
If incident reporting is turned on, All active: also shows Incidents Reported, the number of incident reports for the org unit. When one org unit is selected and your role can view incident reports, the count links to them. See Incident reporting.
Test sessions
Test Sessions lists the org unit's sessions that are still running or ended today. It leaves out cancelled and abandoned sessions. Each row shows the session's name, event, status, creation time and invigilator, and a bar of its test-takers' progress. Select Created or Invigilator to sort the list.
Some roles see a different version of this list. It covers the last 7 days, including today, and its Status filter switches between Last 7 Days and In Progress.
Today's session
If your site generates a test session for each org unit automatically, a Today date only panel can appear between the counts and Test Sessions. It names the session today's test-takers join, with its status and creation date. A chart shows how many test-takers haven't started, are in progress or have finished. Select View Session to open the session.
Exam classes
Sites that schedule exams by class can show an Exam Classes section below Test Sessions. It lists each class with its test-takers' progress and Scheduled Date. Its Status filter offers Upcoming, All for Today and Recently Completed. The icons on each class open its details, print one-time code slips for its test-takers and enrol more test-takers. Schedule New Exam, below the list, schedules a new one.
Assessment events
Assessment Events lists the events being delivered at the org unit, in order of start time, with the progress of their test-takers. Days Left counts down to each event's end date.
- Status filters the events by when they run.
- Select an event's name to open its details page.
- Hover over a bar to see how many test-takers have finished, are in progress or haven't started.
- The eye icon previews the test in a new tab, unrandomised, so items appear in their set order.
- The print icon prints one-time code slips for the event's test-takers.
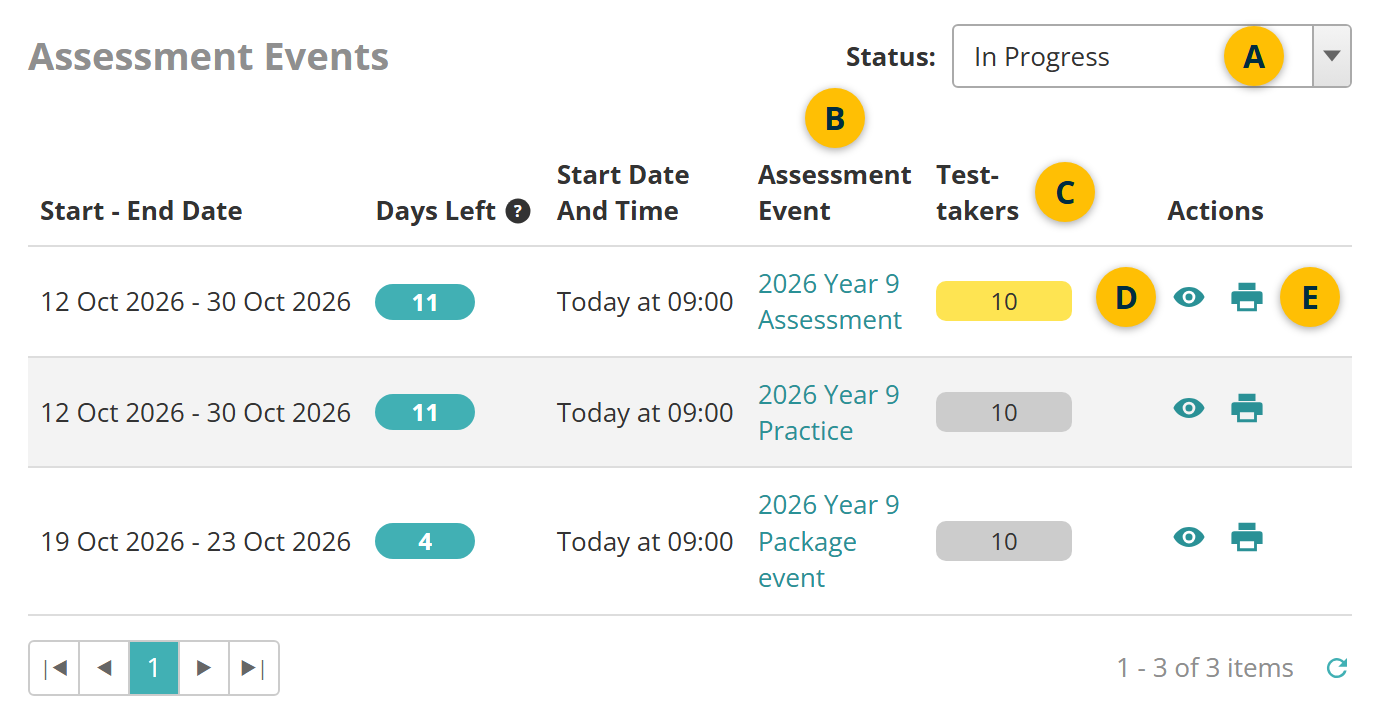
Status offers:
- In Progress — events running now, the default
- Starting in Next Hour — events whose first session starts within the hour
- All for Today — every event with a test day today
- Completed — events that have ended
- Upcoming — events that start later today or on a later day.
The test-takers list further down follows this filter. See Test-takers.
If your site uses Janison Remote proctoring, two more columns appear. Proctoring sync shows whether each event has synced with the proctoring service. Proctoring has a Dashboard button that opens the proctoring dashboard for events you invigilate.
Test-takers
Test-takers lists the attempts in the events that match the Assessment Events status filter. With In Progress selected there, a test-taker in an event that starts later today isn't listed. Change that filter to All for Today to include them. If your role doesn't see Assessment Events, this list covers every event with a test day today.
- Status narrows the list to Not Started Attempts, In Progress, Completed or All.
- Search Test-takers opens a search by name, username or one-time code.
- Actions lists what you can do for that test-taker. See Actions for one test-taker.
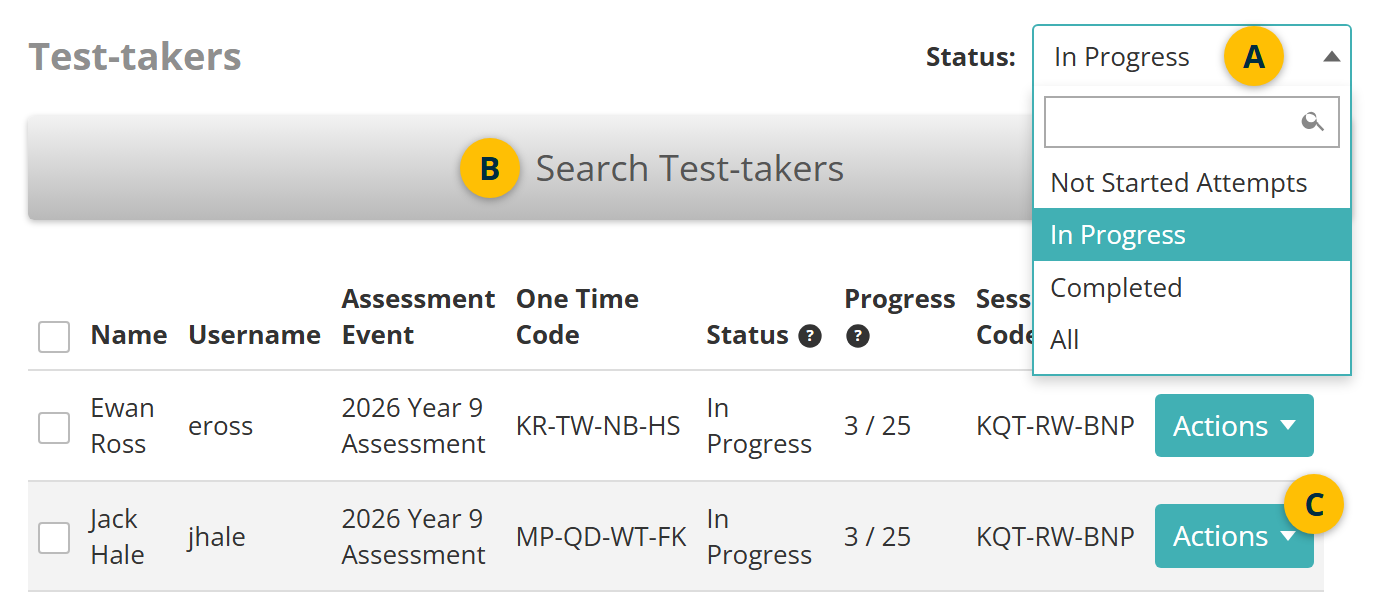
The columns show each test-taker's event, one-time code, status, progress through the test and session code. Further right are the delivery mode, how a Janison Replay attempt was saved (Reconciled), and the test-taker's PNPs. Most column headings sort the list when you select them. An administrator can rename, add hint text to, or hide these columns (see Settings).
When events are linked to assessment packages, the list has a fixed set of columns instead, including Test Package, Component, Connection Mode and Save Method.
In the PNP column, the plus icon shows the test-taker's personal needs and preferences, and the globe icon shows their language preference. See Personal needs and preferences.
A warning triangle beside Actions means the test-taker has failed this event's test several times without passing. Select it to see their attempts.
Actions for one test-taker
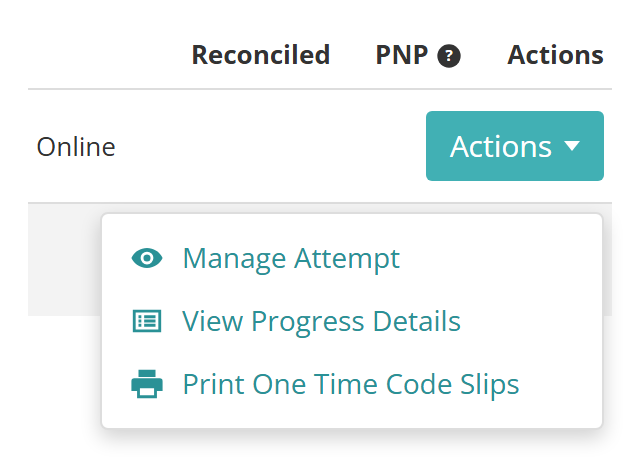
Select Actions on a test-taker's row. Each option depends on your role.
- Manage Attempt opens the test attempt modal, where you can see the attempt's details and change its status. See Test attempt workflows.
- View Progress Details shows the attempt's device, browser and time spent, and each item's progress, including when its answer was saved.
- Print One Time Code Slips prints a slip with the test-taker's one-time code. It appears when the attempt has a one-time code.
Act on several test-takers at once
- Tick the test-takers. A tick box appears on each row that has a one-time code.
- Choose an action from Select to apply a bulk action.
- Select Apply.
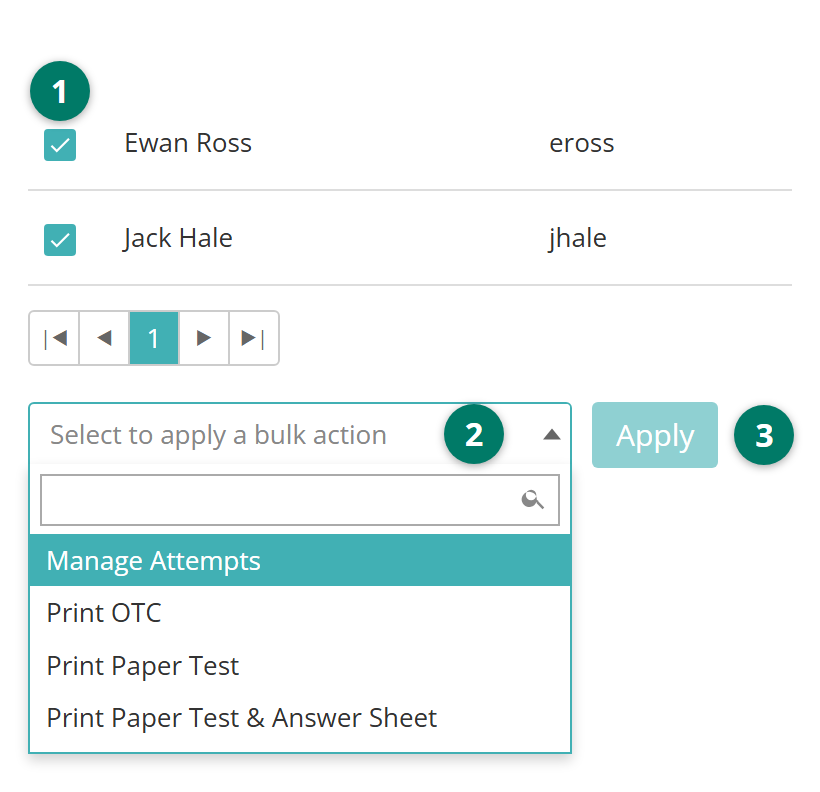
The actions your role allows are:
- Manage Attempts — opens the selected attempts in one window, to act on them together
- Print OTC — prints one-time code slips
- Print Paper Test — prints each test-taker's paper test
- Print Paper Test & Answer Sheet — prints the paper test with an answer sheet, for hybrid test delivery.
Invigilators
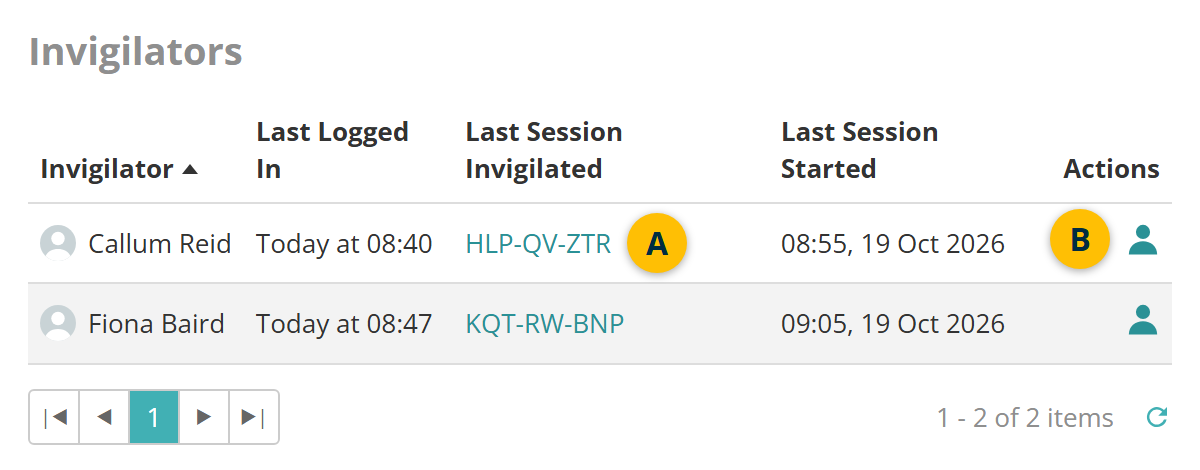
Invigilators lists the invigilators at the org unit, when each last logged in, and the last session they invigilated and when it started.
- Select a code under Last Session Invigilated to open that session's administration page.
- The person icon opens the invigilator's contact details.
Janison Replay
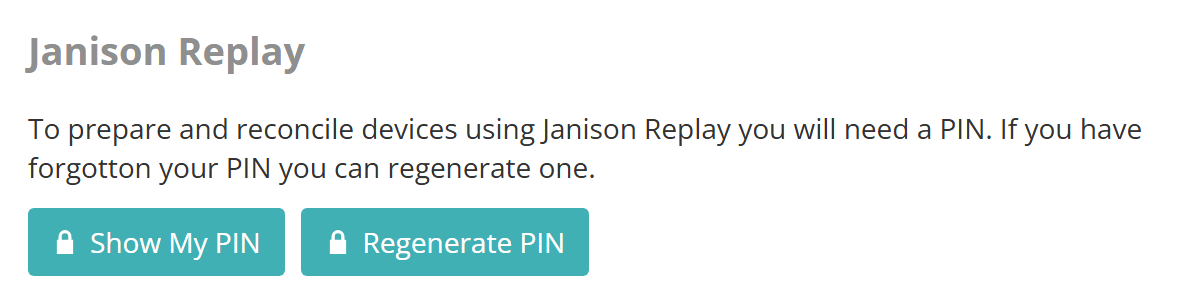
Janison Replay holds the PIN you need to prepare and reconcile devices that run Janison Replay.
- Show My PIN displays your PIN.
- Regenerate PIN replaces it with a new one.
- Show Org Unit PIN displays the PIN for the selected org unit, if your site uses org unit PINs. It also unlocks Replay.
If your site has stored download links for the test player, the section also shows Download Janison Insights Test Player:, with a tile for each of Android, iOS and Windows. See Janison Replay.
Create a test session
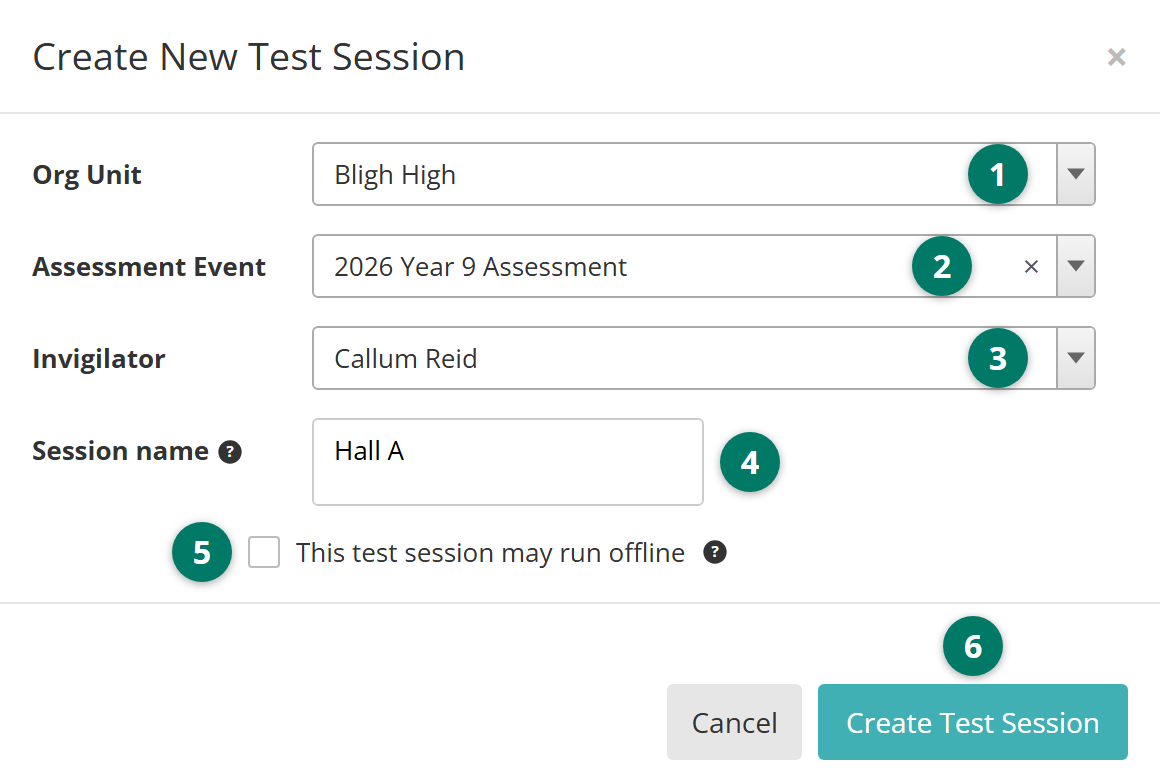
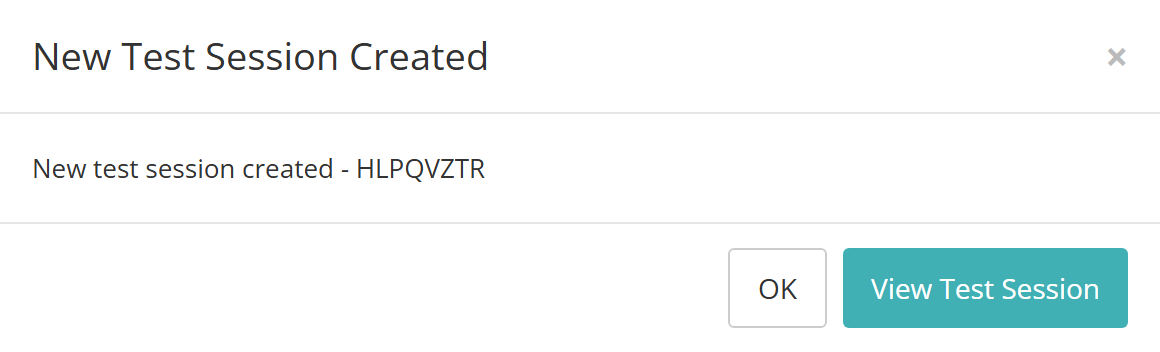
Select Create New Test Session, beside the Test Sessions heading. What happens next depends on your site's settings. Some sites create the session straight away for the selected org unit, and New Test Session Created appears. Others open the Create New Test Session form:
- Org Unit is the one selected on the dashboard. Change it if you need to.
- Select the Assessment Event. To use the session for more than one event, leave it blank, unless your site requires one.
- Invigilator starts as you. If your role allows, select someone else.
- Optionally, enter a Session name of up to 50 characters. It shows at the top of the session's administration page and in the dashboard's Session Name column.
- Optionally, tick This test session may run offline. It tells the invigilator that some test-takers may use Janison Replay offline. They won't appear in the session straight away, so the invigilator should wait until every device is reconciled before finalising the session.
- Select Create Test Session.
Session name and This test session may run offline appear only if your site has turned them on.
New Test Session Created shows the new session's code. Select View Test Session to open the session's administration page, or OK to stay on the dashboard. See Test session administration.
Settings
Administrators configure the following at Settings > Assessment Event Settings.
Ask for Assessment Event, Invigilator and Room details when creating test session — opens the Create New Test Session form when you create a session. While it's off, the session is created straight away.
Require an assessment event when creating a test session — makes Assessment Event required in that form.
Enable test session name — adds Session name to the form.
Exclude Option to View "All" Test Centres — removes All from Org Unit.
Link Session Based Assessment Events to — when set to Assessment Packages, the test-takers list uses its fixed package columns.
Enable Incident reporting functionality for session invigilation — adds the Incidents Reported count.
Enable test preview by Invigilators — lets invigilators and presiding examiners preview an unrandomised version of the test from Assessment Events.
Enable Org Unit Invigilation Pin — creates a PIN for each org unit and adds Show Org Unit PIN.
Display Invigilator Pin On Delivery Dashboard — shows Show My PIN and Regenerate PIN. It's on by default.
Exam Class Scheduling Settings — exam class scheduling, with an Exam Class Group Type chosen, adds Schedule New Exam to Exam Classes.
These are at Settings > Test Delivery Settings.
Enable Offline Reliable Delivery — adds This test session may run offline to the form.
Enable Today Session on Delivery Dashboard — shows the today's session panel. It also needs Enable Auto Generation of Test Sessions for Org Units and a generated session for the org unit.
Enable failed test attempt alert and Number of Failed Attempts — show the warning triangle beside a test-taker who has failed at least that many attempts without passing.
Android Test Player Url, iOS Test Player Url and Windows App Test Player Url — add the download tiles to Janison Replay.
At Settings > Dashboard Settings, Table Grid Display Settings sets the columns of each list on this dashboard. Choose a list in Page/Grid Name, then set each column's Caption, Hint Text and Visible.
Each section of the dashboard is a separate permission, as are Create New Test Session, the session download and each test-taker action. Administrators grant them per role at Settings > Roles. If a section or button described here doesn't appear for you, your role may not include it.